920-436-8299 [email protected]

Emergency Department Advisor™

Your ED is the Patient’s Gateway to Your Hospital — Gain the Insight to Keep it Running at Peak Efficiency

Emergency Department Advisor

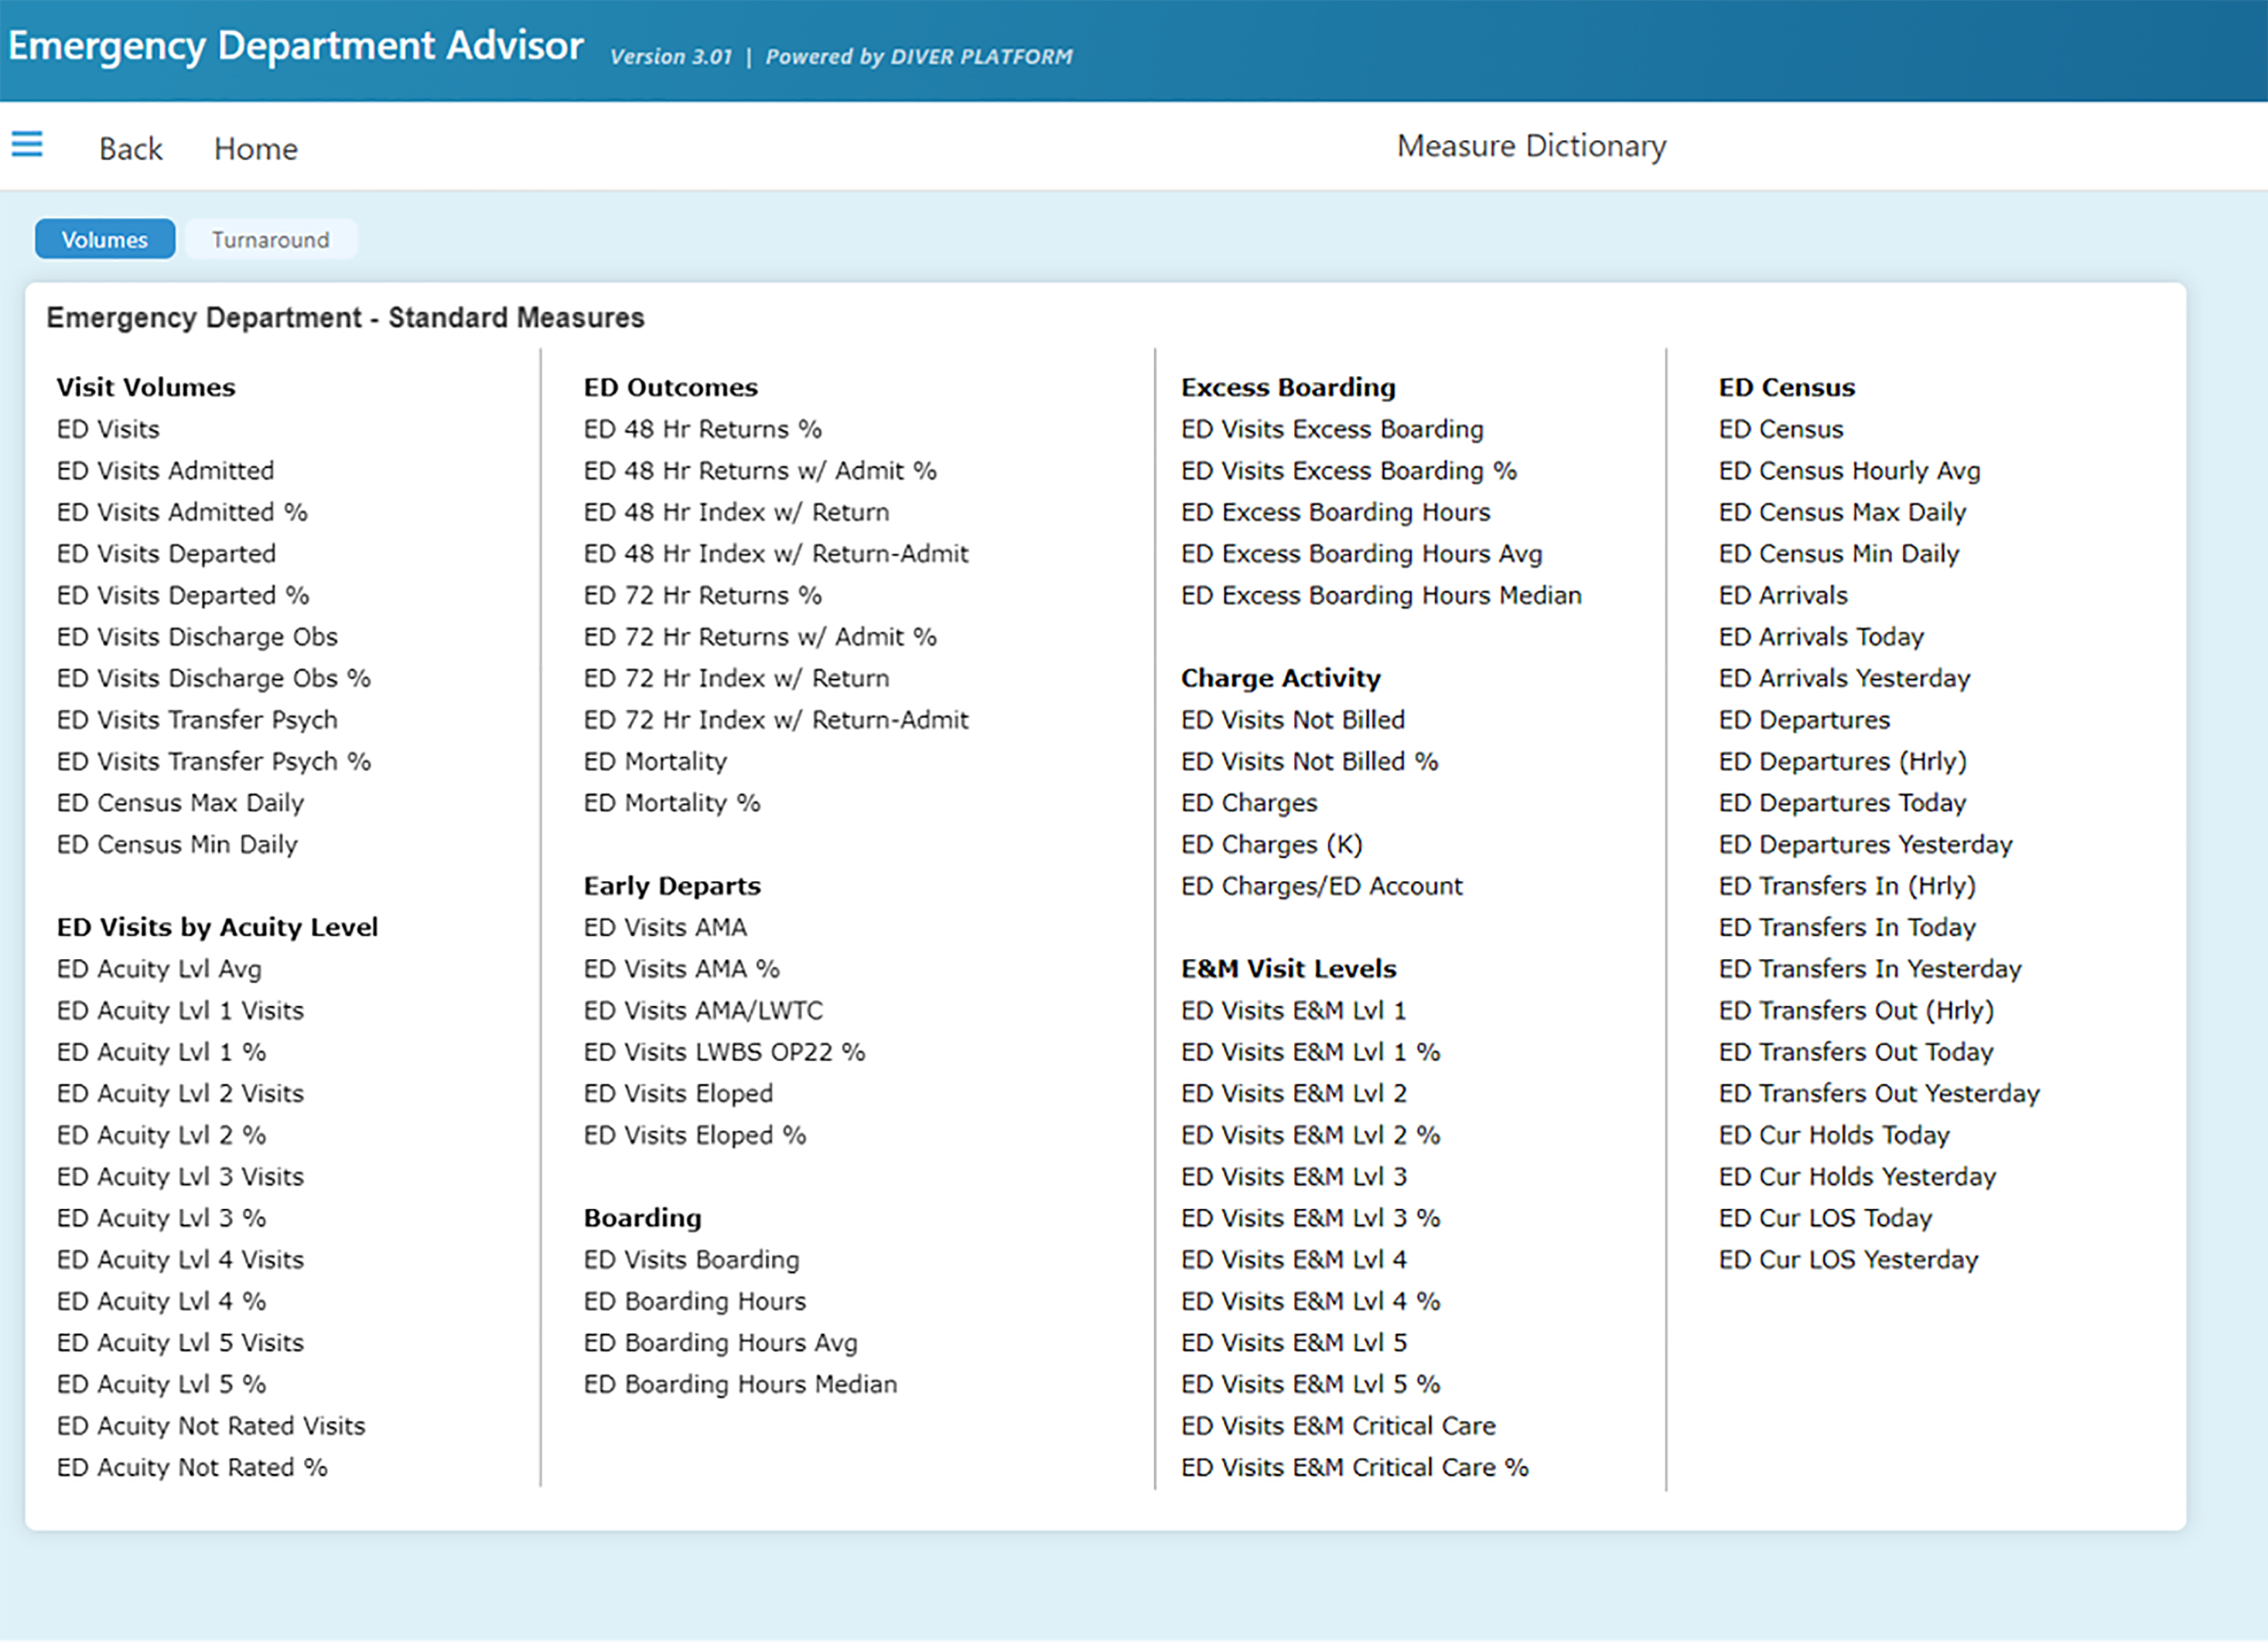
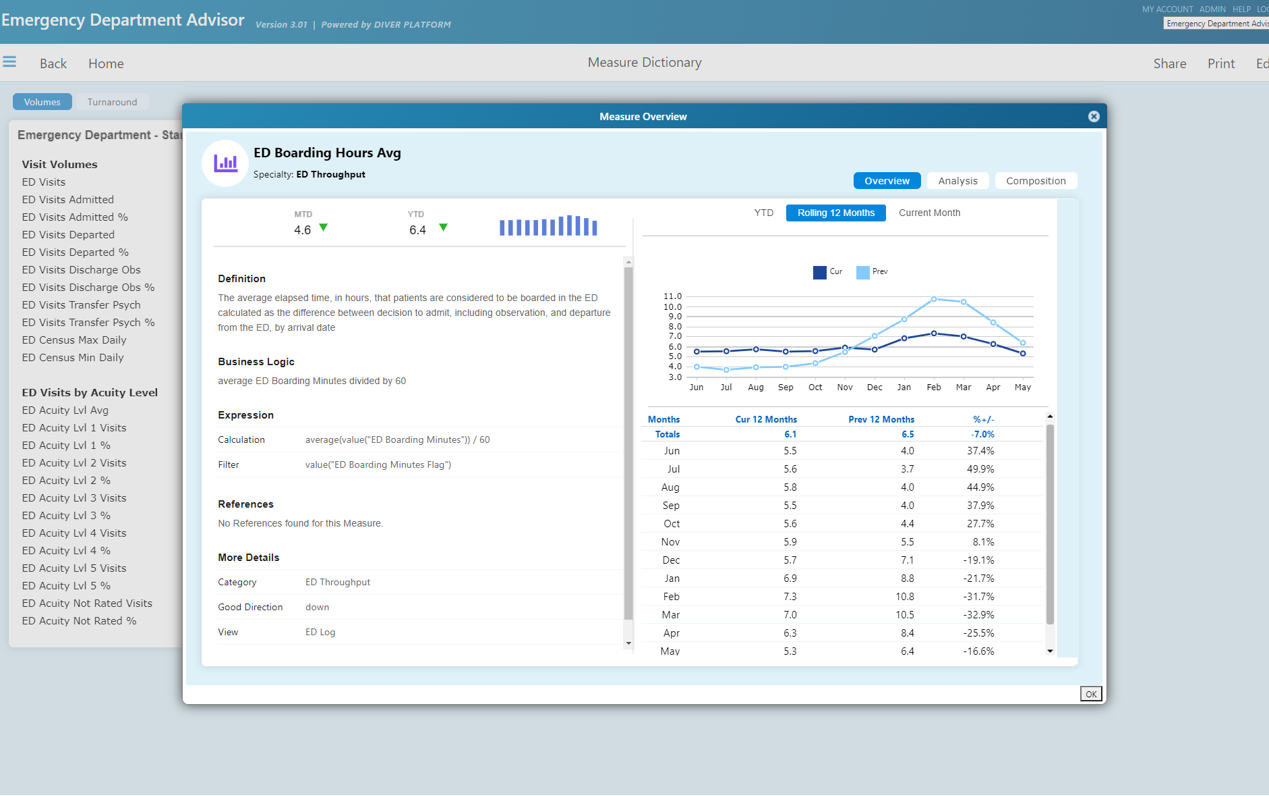
More than 600 off-the-shelf KPIs

When patients visit your emergency department, they need to be treated safely and effectively. Anything else just adds on to what is already a fraught experience. The more streamlined and consumer-friendly your ED is, the more likely patients will have a positive experience and trust your hospital for their families’ care.

When you think about improving your ED operations, it’s important to look at not just your processes on how you treat patients and ensure quality and safety, but also your waste or moments when patients are left waiting—leading to patient frustration, higher left without being seen (LWBS) numbers, and worse patient outcomes.

Dimensional Insight’s Emergency Department Advisor helps you make sense of your wealth of data to make the right improvements to increase revenue, improve patient satisfaction scores, and improve patient outcomes.

Benefits of Emergency Department Advisor

Reduce patient wait time

One hospital decreased LWBS by 83% and increased revenue by more $2 million

Increase throughput

One hospital reduced cardiac throughput by 40%, resulting in a 67% reduction in mortality rate

Optimize volume and utilization

See up to 75% decrease in low-acuity and unnecessary visits

Reduce overtime

One hospital saved more than $250,000 due to better scheduling insights

Make data more available and empower users

Self-service dashboards enable up to 90% reduction in the time spent collecting, analyzing, and visualizing data

Access to Industry Standard Out-of-the-Box Measures

Emergency Department Advisor comes with 600+ out-of-the-box measures that can be quickly implemented in your hospital. These measures include:

ED Volumes
  • ED Acuity Lvl 1 Visits The number of ED visits with an ESI triage acuity rating of Level 1 (Resuscitation), by arrival date
  • ED Acuity Lvl 2 Visits The number of ED visits with an ESI triage acuity rating of Level 2 (Emergent), by arrival date
  • ED Acuity Lvl 3 Visits The number of ED visits with an ESI triage acuity rating of Level 3 (Urgent), by arrival date
  • ED Acuity Lvl 4 Visits The number of ED visits with an ESI triage acuity rating of Level 4 (Less Urgent), by arrival date
  • ED Acuity Lvl 5 Visits The number of ED visits with an ESI triage acuity rating of Level 5 (Nonurgent), by arrival date
  • ED Acuity Lvl Avg The average acuity level for ED visits, by arrival date
  • ED Acuity Not Rated Visits The number of ED visits without an acuity scale rating, by arrival date
  • ED Visits Departed % The number of ED visits that departed, either from being seen, treated, and discharged or left against medical advice, and were not an admitted patient or under observation, by arrival date
  • ED Visits Eloped The number of ED visits with a discharge disposition of eloped, by arrival date
  • ED Visits Hospitalized The number of ED visits who are hospitalized, meaning admitted as inpatients or discharged to observation, by arrival date
  • ED Visits Hospitalized % The percentage of ED visits who are hospitalized, meaning admitted as inpatients or discharged to observation, of all ED visits, by arrival date
  • ED Visits Incomplete Treatment The number of ED visits that departed without completing treatment, by arrival date
  • ED Visits LWBS The number of ED visits that left without being seen, by arrival date. This measure is consistent with the definition of the CMS OP-22 outpatient quality measure
  • ED Visits Not Billed The number of ED visits that are not billed, by arrival date
  • ED Visits Not Billed % The percentage of ED visits that are not billed, by arrival date

  • ED Visits Not Dispositioned The number of ED visits without a disposition code, by arrival date
  • ED Visits Transfer The number of ED visits who were discharged with a transfer disposition, by arrival date
  • ED Visits Transfer Acute The number of ED visits who were transferred to an acute care facility, by arrival date
  • ED Visits Transfer Psych The number of ED visits who were transferred to a psychiatric facility, by arrival date
  • ED Visits Treat/Release % The percentage of ED visits that were treated and released, of all ED visits, by arrival date
ED Throughput
  • ED Admits LOS ED1 Median The median elapsed time, in minutes, between arrival to and departure from the ED for admitted patients, by arrival date
  • ED All LOS Avg The average elapsed time, in minutes, between arrival to and departure from the ED for all ED visits, by arrival date
  • ED All LOS Median The median elapsed time, in minutes, between arrival to and departure from the ED for all ED visits, by arrival date
  • ED Arrival-Provider Avg The average elapsed time, in minutes, between arrival to the ED and the first time seen by a provider (physician, physician assistant, nurse practitioner, advanced practice registered nurse) for ED visits seen by a provider, by arrival date
  • ED Arrival-Triage Avg The average elapsed time, in minutes, between arrival to the ED and triage, for triaged ED visits, by arrival date
  • ED Arrival-Triage Median The median elapsed time, in minutes, between arrival to the ED and triage, for triaged ED visits, by arrival date
  • ED Boarding Hours The total elapsed time, in hours, that patients are considered to be boarded in the ED, calculated as the difference between decision to admit (including observation) and departure from the ED, by arrival date
  • ED Boarding Hours Avg The average elapsed time, in hours, that patients are considered to be boarded in the ED, calculated as the difference between decision to admit (including observation) and departure from the ED, by arrival date
  • ED Boarding Hours MedianThe median elapsed time, in hours, that patients are considered to be boarded in the ED, calculated as the difference between decision to admit (including observation) and departure from the ED, by arrival date
  • ED Departs LOS Avg The average elapsed time, in minutes, between arrival to and departure from the ED for all ED visits not admitted as inpatients or for observation, by arrival date

  • ED Excess Boarding Hours The total elapsed time, in hours, the patient is considered boarding for more than 4 hours (240 minutes), by arrival date
  • ED Excess Boarding Hours Avg The average elapsed time, in hours, the patient is considered boarding for more than 4 hours (240 minutes), by arrival date
  • ED Excess Boarding Hours Median The median elapsed time, in hours, the patient is considered boarding for more than 4 hours (240 minutes), by arrival date
  • ED Obs LOS Avg The average elapsed time, in minutes, between arrival to and departure from the ED for visits discharged from observation, by arrival date
  • ED Obs LOS Median The median elapsed time, in minutes, between arrival to and departure from the ED for visits discharged from observation, by arrival date
  • ED Provider-Decision Avg The average elapsed time, in minutes, between the time an ED patient is first seen by a provider and the decision to admit the patient as an inpatient or for observation, by arrival date
  • ED Provider-Depart Avg The average elapsed time, in minutes, between the time an ED patient is first seen by a provider and the decision to admit the patient as an inpatient or for observation, by arrival date
  • ED Provider-Depart Median The median elapsed time, in minutes, between the time an ED patient is first seen by a provider and ED departure, by arrival date
  • ED Room-Provider Avg The average elapsed time, in minutes, between the time a patient is moved to a room and the first time seen by a provider (physician, physician assistant, nurse practitioner, advanced practice registered nurse), by arrival date
  • ED Room-Provider Median The median elapsed time, in minutes, between triage and the first time seen by a provider (physician, physician assistant, nurse practitioner, advanced practice registered nurse), by arrival date
  • ED Triage-Provider Avg The median elapsed time, in minutes, between the time a patient is moved to a room and the first time seen by a provider (physician, physician assistant, nurse practitioner, advanced practice registered nurse)r, by arrival date
  • ED Triage-Provider Median The median elapsed time, in minutes, between triage and the first time seen by a provider (physician, physician assistant, nurse practitioner, advanced practice registered nurse), by arrival date
  • ED Triage-Room Avg The average elapsed time, in minutes, between triage and the time a patient is moved to a room, by arrival date
  • ED Triage-Room Median The median elapsed time, in minutes, between triage and the time a patient is moved to a room, by arrival date
  • ED Visits Boarding The number of ED visits that are boarding, including admitted patients and those under observation, by arrival date
  • ED Visits Boarding % The percentage of ED visits that are boarding, including admitted patients and those under observation, of hospitalized ED visits, by arrival date
  • ED Visits Excess Boarding The number of ED visits with boarding greater than 4 hours (240 minutes), of all ED visits, by arrival date
  • ED Visits Excess Boarding % The percentage of ED visits with boarding greater than 4 hours (240 minutes), of all ED visits, by arrival date
  • ED Visits w/ Consult The number of ED visits that had a consult ordered, by arrival date
  • ED Visits w/ Consult % The percentage of all ED visits that had a consult ordered, of all ED Visits, by arrival date
ED Quality
  • ED 48 Hr Returns w/ Admit % The percentage of ED visits (ED index accounts) returning to the ED within 48 hours of departure of the admitted index visit, by arrival date
  • ED 72 Hr Returns w/ Admit % The percentage of ED visits (ED index accounts) which were followed by another ED visit by the same patient within 72 hours of departure of the index visit that resulted in an admission, by arrival date
  • ED Admit-Obs Decision-Depart Avg The average elapsed time, in minutes, between the decision to admit to observation and the time the patient leaves the ED, by arrival date
  • ED Admit-Obs Decision-Depart Median The median elapsed time, in minutes, between the decision to admit to observation and the time the patient leaves the ED, by arrival date
  • ED Admit-Psych Decision-Depart Avg The average elapsed time, in minutes, between the decision to admit to an inpatient pyschiatric unit and the time the patient leaves the ED, by arrival date
  • ED Admit-Psych Decision-Depart Median The median elapsed time, in minutes, between the decision to admit to an inpatient pyschiatric unit and the time the patient leaves the ED, by arrival date
  • ED Admit-Psych LOS Avg The average elapsed time, in minutes, between arrival to and departure from the ED for patients admitted to a psychiatric unit, by arrival date
  • ED Admit-Psych LOS Median The median elapsed time, in minutes, between arrival to and departure from the ED for patients admitted to a psychiatric unit, by arrival date
  • ED Admits Decision-Depart Avg The average elapsed time, in minutes, between the decision to admit and ED departure for ED visits admitted as inpatients, by arrival date
  • ED Admits Decision-Depart ED2 Median The median elapsed time, in minutes, between the decision to admit and ED departure for ED visits admitted as inpatients, by arrival date. This definition is consistent with CMS ED 2.1 hospital quality measure.
  • ED Admits LOS Avg The average elapsed time, in minutes, between arrival to and departure from the ED for admitted patients, by arrival date
  • ED Arrival-Provider Median The median elapsed time, in minutes, between arrival to the ED and the first time seen by a provider (physician, physician assistant, nurse practitioner, advanced practice registered nurse) for ED visits seen by a provider, by arrival date
  • ED Departs LOS OP18 Median The median elapsed time, in minutes, between arrival to and departure from the ED for all ED visits not admitted as inpatients or for observation, by arrival date
  • ED Provider-Decision Median The median elapsed time, in minutes, between the time an ED patient is first seen by a provider and the decision to admit the patient as an inpatient or for observation, by arrival date
  • ED Visits Admit-Psych The number of ED visits admitted to an inpatient psychiatric unit, by arrival date
  • ED Visits Admit-Psych % The percentage of ED visits that were admitted and have a psychiatric account, by arrival date
  • ED Visits AMA % The percentage of ED visits with a discharge disposition of AMA, of all ED visits, by arrival date
  • ED Visits E&M Critical Care The number of all ED visits with an evaluation and management (E&M) CTP code classified as critical care, by arrival date
  • ED Visits E&M Critical Care % The percentage of ED visits that are billable and with an evaluation and management (E&M) CTP code classified as critical care, by arrival date
  • ED Visits E&M Lvl 1 The number of ED visits with E&M level 1, by arrival date
  • ED Visits E&M Lvl 1 % The percentage of ED visits with E&M level 1 of all ED visits, by arrival date
  • ED Visits E&M Lvl 2 The number of ED visits with E&M level 2, by arrival date
  • ED Visits E&M Lvl 2 % The percentage of ED visits with E&M level 2 of all ED visits, by arrival date
  • ED Visits E&M Lvl 3 The number of ED visits with E&M level 3, by arrival date
  • ED Visits E&M Lvl 3 % The percentage of ED visits with E&M level 3 of all ED visits, by arrival date
  • ED Visits E&M Lvl 4 The number of ED visits with E&M level 4, by arrival date
  • ED Visits E&M Lvl 4 % The percentage of ED visits with E&M level 4 of all ED visits, by arrival date
  • ED Visits E&M Lvl 5 The number of ED visits with E&M level 5, by arrival date
  • ED Visits E&M Lvl 5 % The percentage of ED visits with E&M level 5 of all ED visits, by arrival date
  • ED Visits Eloped % The percentage of ED visits with discharge disposition eloped, of all ED visits, by arrival date
  • ED Visits LWBS OP22 % The percentage of ED visits that left without being seen, by arrival date. This measure is consistent with the definition of the CMS OP-22 outpatient quality measure
  • ED Visits Transfer Acute % The percentage of ED visits who were transferred to an acute care facility, of all ED visits, by arrival date
  • ED Visits Treat/Release The number of ED visits that were treated and released, by arrival date
ED Performance
  • ED Acuity Lvl 1 % The percentage of ED visits with an ESI triage acuity rating of Level 1 (Resuscitation), by arrival date
  • ED Acuity Lvl 2 % The percentage of ED visits with an ESI triage acuity rating of Level 2 (Emergent), by arrival date
  • ED Acuity Lvl 3 % The percentage of ED visits with an ESI triage acuity rating of Level 3 (Urgent), by arrival date
  • ED Acuity Lvl 4 % The percentage of ED visits with an ESI triage acuity rating of Level 4 (Less Urgent), by arrival date
  • ED Acuity Lvl 5 % The percentage of ED visits with an ESI triage acuity rating of Level 5 (Nonurgent), by arrival date
  • ED Acuity Not Rated % The percentage of ED visits without an acuity scale rating, by arrival date
  • ED Visits Discharge Obs % The percentage of all ED visits that were discharged to observation, by arrival date
  • ED Visits Transfer Psych % The percentage of ED visits who were transferred to a psychiatric facility, of all ED visits, by arrival date
ED Orders
  • ED Arrival-First Consult Order Avg The average elapsed time, in minutes, between arrival to the ED and the first order for a consultation, by arrival date
  • ED Arrival-First Consult Order Median The median elapsed time, in minutes, between arrival to the ED and the first order for a consultation, by arrival date
  • ED Arrival-First CT Order Avg The average elapsed time, in minutes, between arrival to the ED and the first order for a CT scan, by arrival date
  • ED Arrival-First CT Order Median The median elapsed time, in minutes, between arrival to the ED and the first order for a CT scan, by arrival date
  • ED Arrival-First CT Result Avg The average elapsed time, in minutes, between arrival to the ED and the first result from a CT order, by arrival date
  • ED Arrival-First CT Result Median The median elapsed time, in minutes, between arrival to the ED and the first result from a CT order, by arrival date
  • ED Arrival-First Head CT Result Avg The average elapsed time, in minutes, between arrival to the ED and the first result from a head CT order, by arrival date
  • ED Arrival-First Head CT Result Median The median elapsed time, in minutes, between arrival to the ED and the first result from a head CT order, by arrival date
  • ED Arrival-First Imaging Order Avg The average elapsed time, in minutes, between arrival to the ED and the first imaging order, by arrival date
  • ED Arrival-First Imaging Order Median The median elapsed time, in minutes, between arrival to the ED and the first imaging order, by arrival date
  • ED Arrival-First Imaging Result Avg The average elapsed time, in minutes, between arrival to the ED and the first result from an imaging order, by arrival date
  • ED Arrival-First Imaging Result Median The median elapsed time, in minutes, between arrival to the ED and the first result from an imaging order, by arrival date
  • ED Arrival-First Lab Order Avg The average elapsed time, in minutes, between arrival to the ED and the first lab order, by arrival date
  • ED Arrival-First Lab Order Median The median elapsed time, in minutes, between arrival to the ED and the first lab order, by arrival date
  • ED Arrival-First Lab Result Avg The average elapsed time, in minutes, between arrival to the ED and the first result from a lab order, by arrival date
  • ED Arrival-First Lab Result Median The median elapsed time, in minutes, between arrival to the ED and the first result from a lab order, by arrival date
  • ED Arrival-First MRI Order Avg The average elapsed time, in minutes, between arrival to the ED and the first MRI order, by arrival date
  • ED Arrival-First MRI Order Median The median elapsed time, in minutes, between arrival to the ED and the first MRI order, by arrival date
  • ED Arrival-First Order PG Avg The average elapsed time, in minutes, between arrival to the ED and the first order within an order procedure group, by arrival date
  • ED Arrival-First Order PG Median The median elapsed time, in minutes, between arrival to the ED and the first order within an order procedure group, by arrival date
  • ED Arrival-First Result Avg The average elapsed time, in minutes, between arrival to the ED and the first result for an individual order, by arrival date
  • ED Arrival-First Result Median The median elapsed time, in minutes, between arrival to the ED and the first result for an individual order, by arrival date
  • ED Arrival-First Result PG Avg The average elapsed time, in minutes, between arrival to the ED and the first result within an order procedure group, by arrival date
  • ED Arrival-First Result PG Median The median elapsed time, in minutes, between arrival to the ED and the first result within an order procedure group, by arrival date
  • ED Arrival-First Xray Order Avg The average elapsed time, in minutes, between arrival to the ED and the first Xray order, by arrival date
  • ED Arrival-First Xray Order Median The median elapse time, in minutes, between arrival to the ED and recieves a first order for an xray, by arrival date
  • ED Arrival-Last Consult Order Avg The average elapsed time, in minutes, between arrival to the ED and the last consultation order, by arrival date
  • ED Arrival-Last Consult Order Median The median elapsed time, in minutes, between arrival to the ED and the last consultation order, by arrival date
  • ED Arrival-Last Imaging Order Avg The average elapsed time, in minutes, between arrival to the ED and the last imaging order, by arrival date
  • ED Arrival-Last Imaging Order Median The median elapsed time, in minutes, between arrival to the ED and the last imaging order, by arrival date
  • ED Arrival-Last Lab Order Avg The average elapsed time, in minutes, between arrival to the ED and the last lab order, by arrival date
  • ED Arrival-Last Lab Order Median The median elapsed time, in minutes, between arrival to the ED and the last lab order, by arrival date
  • ED Arrival-Last Result Avg The average elapsed time, in minutes, between arrival to the ED and the last result for an individual order, by arrival date
  • ED Arrival-Last Result Median The median elapsed time, in minutes, between arrival to the ED and the last result for an individual order, by arrival date
  • ED Arrival-Order Avg The average elapsed time, in minutes, between arrival to the ED and the time an individual order is placed, by arrival date
  • ED Arrival-Order Median The median elapsed time, in minutes, between arrival to the ED and the time an individual order is placed, by arrival date
  • ED Visits w/ CT Scan The number of ED visits that had a CT scan ordered, by arrival date
  • ED Visits w/ CT Scan % The percentage of all ED visits that had a CT scan ordered, by arrival date
  • ED Visits w/ Imaging The number of ED visits that had an imaging ordered, by arrival date
  • ED Visits w/ Imaging % The percentage of all ED visits that had an imaging ordered, by arrival date
  • ED Visits w/ Labs The number of ED visits that had a lab ordered, by arrival date
  • ED Visits w/ Labs % The percentage of all ED visits that had a lab ordered, by arrival date
  • ED Visits w/ MRI The number of ED visits that had an MRI ordered, by arrival date
  • ED Visits w/ MRI % The percentage of all ED visits that had an MRI scan ordered, by arrival date
  • ED Visits w/ Order The number of ED Visits with at least one lab, imaging, or consult order, by arrival date
  • ED Visits w/ Order % The percentage of all ED visits that had a lab or imaging ordered, by arrival date
  • ED Visits w/ Xray The number of ED visits that had an xray ordered, by arrival date
  • ED Visits w/ Xray % The percentage of all ED visits that had an xray ordered, by arrival date
  • First Consult Order-ED Depart Avg The average elapsed time, in minutes, between the first order for a consultation and the time a patient departs from the emergency department, by arrival date
  • First Consult Order-ED Depart Median The median elapsed time, in minutes, between the first order for a consultation and the time a patient departs from the ED, by arrival date
  • First Imaging Order-ED Depart Avg The average elapsed time, in minutes, between the first order for imaging and the time a patient departs from the ED, by arrival date
  • First Imaging Order-ED Depart Median The median elapsed time, in minutes, between the first order for imaging and the time a patient departs from the ED, by arrival date
  • First Lab Order-ED Depart Avg The average elapsed time, in minutes, between the first order for a lab and the time a patient departs from the ED, by arrival date
  • First Lab Order-ED Depart Median The median elapsed time, in minutes, between the first order for a lab and the time a patient departs from the ED, by arrival date
  • Last CT Result-ED Depart Avg The average elapsed time, in minutes, between the last result for a CT scan and the time a patient departs from the ED, by arrival date
  • Last CT Result-ED Depart Median The median elapsed time, in minutes, between the last result for a CT scan and the time a patient departs from the ED, by arrival date
  • Last Imaging Result-ED Depart Avg The average elapsed time, in minutes, between the last result for imaging and the time a patient departs from the ED, by arrival date
  • Last Imaging Result-ED Depart Median The median elapsed time, in minutes, between the last result for imaging and the time a patient departs from the ED, by arrival date
  • Last Lab Result-ED Depart Avg The average elapsed time, in minutes, between the last result for a lab and the time a patient departs from the ED, by arrival date
  • Last Lab Result-ED Depart Median The median elapsed time, in minutes, between the last result for a lab and the time a patient departs from the ED, by arrival date
  • Last MRI Result-ED Depart Avg The average elapsed time, in minutes, between the last result for an MRI and the time the patient departs from the ED, by arrival date
  • Last Result After ED Depart The number of last results received after the patient departs the ED, by arrival date
  • Last Result After ED Depart % The percentage of last results received after the patient departs the ED of all orders, by arrival date
  • Last Result-ED Depart Avg The average elapsed time, in minutes, between the last result and the time the patient departs from the ED, by arrival date
  • Last Result-ED Depart Median The median elapsed time, in minutes, between the last result and the time the patient departs from the ED, by arrival date
  • Last Xray Result-ED Depart Avg The average elapsed time, in minutes, between the last result for an xray and the time patient departs from the ED, by arrival date
  • Last Xray Result-ED Depart Median The median elapsed time, in minutes, between the last result for an xray and the time patient departs from the ED, by arrival date
  • Order-ED Depart Avg The average elapsed time, in minutes, between the time an order is placed and the time the patient departs from the ED, by arrival date
  • Order-ED Depart Median The median elapsed time, in minutes, between the time an order is placed and the time the patient departs from the ED, by arrival date
  • Order-First Result Avg The average elapsed time, in minutes, between the time an order is placed and the first result, by arrival date
  • Order-First Result Median The median elapsed time, in minutes, between the time an order is placed and the first result, by arrival date
  • Order-Last Result Avg The average elapsed time, in minutes, between the time an order is placed and the last result, by arrival date
  • Order-Last Result Median The median elapsed time, in minutes, between the time an order is placed and the last result, by arrival date
ED Order Performance
  • ED TAT Accounts The number of unique accounts with values for time segments specified by the ED Visit TAT Segment dimension in the ED Turnaround Times dataset, by arrival date

  • ED TAT Mins Avg The average elapsed time, in minutes, for time segments specified by the ED Visit TAT Segment dimension in the ED Turnaround Times dataset, by arrival date

  • ED TAT Mins Median The median elapsed time, in minutes, for time segments specified by the ED Visit TAT Segment dimension in the ED Turnaround Times dataset, by arrival date

  • ED Valid TAT The number of ED visits with valid time period calculations, by arrival date

  • ED Valid TAT % The percentage of ED visits with valid time period calculations, by arrival date

ED Hospital Ops
  • ED 48 Hr Index w/ Return The number of ED visits (ED index accounts) which were followed by another ED visit by the same patient arriving within 48 hours of the previous ED departure, by arrival date. ED index accounts include all ED visits, including patients who expired, departed against medical advice, or transferred from the ED. If arrival or departure times are not available, 2 days are used instead of 48 hours.
  • ED 48 Hr Index w/ Return-AdmitThe number of ED visits (ED index accounts) which were followed by another ED visit by the same patient arriving within 48 hours of the previous ED departure that resulted in an admission. ED index accounts include all ED visits including patients those who expired, departed against medical advice, or were transferred from the ED. If arrival or departure times are not available, 2 days will be used instead of 48 hours.
  • ED 48 Hr ReturnsThe number of ED patients returning to the ED within 48 hours of departure, excluding those who left against medical advice, by arrival date
  • ED 48 Hr Returns %The percentage of ED visits (ED index accounts) which were followed by another ED visit by the same patient within 48 hours of departure of the index visit, by arrival date
  • ED 48 Hr Returns w/ AdmitThe number of ED visits returning to the ED within 48 hours of departure who were admitted, excluding those who left against medical advice, by arrival date
  • ED 72 Hr Index w/ ReturnThe number of ED visits (ED index accounts) which were followed by another ED visit by the same patient arriving within 72 hours of the previous ED departure, by arrival date. ED index accounts include all ED visits, including patients those who expired, departed against medical advice, or were transferred from the ED. If arrival or departure times are not available, 3 days is used instead of 72 hours.
  • ED 72 Hr Index w/ Return-AdmitThe number of ED visits (ED index accounts) which were followed by another ED visit by the same patient arriving within 72 hours of the previous ED departure that resulted in an admission. ED index accounts include all ED visits including patients those who expired, departed against medical advice, or were transferred from the ED. If arrival or departure times are not available, 3 days will be used instead of 72 hours.
  • ED 72 Hr ReturnsThe number of ED patients returning to the ED within 72 hours of departure, excluding those who left against medical advice, by arrival date
  • ED 72 Hr Returns %The percentage of ED visits (ED index accounts) which were followed by another ED visit by the same patient within 72 hours of departure of the index visit, by arrival date.
  • ED 72 Hr Returns w/ AdmitThe number of ED visits returning to the ED within 72 hours of departure who were admitted, excluding those who left against medical advice, by arrival date
  • ED Arrival-Admit AvgThe average elapsed time, in minutes, between arrival to the ED and admission for admitted patients, by arrival date
  • ED Arrival-Admit MedianThe median elapsed time, in minutes, between arrival to the ED and admission for admitted patients, by arrival date
  • ED MortalityThe number of visits with a mortality with a discharge status of expired, by arrival date
  • ED Mortality %The percentage of visits with a mortality with a discharge status of expired, by arrival date
  • ED Return Index PopulationThe number of ED visits eligible to be counted as ED index visits for the purpose of calculating ED return rate measures.
  • ED VisitsThe number of accounts with at least one ED Encounter, by arrival date
  • ED Visits AdmittedThe number of ED visits admitted as inpatients, by arrival date
  • ED Visits Admitted %The percentage of ED visits admitted as inpatients, of all ED visits seen, by arrival date
  • ED Visits AMA/LWTCThe number of ED visits with a discharge disposition of against medical advice (AMA) or before completing care, of all ED visits, by arrival date
  • ED Visits DepartedThe number of ED visits that departed, either from being seen, treated, and discharged or left against medical advice, and were not an admitted patient or under observation, by arrival date
  • ED Visits Discharge ObsThe number of ED visits that were discharged to observation, by arrival date
ED Financial
  • ED Charges The total number of ED charges, by arrival date
  • ED Charges (K) The total number of ED charges, in thousands, by arrival date
  • ED Charges/ED Account The ratio of ED charges to account ID, by arrival date
ED Census
  • ED Visits AMA The number of ED visits with an ED discharge disposition of against medical advice (AMA), by arrival date
  • ED Arrivals The number of patients arriving in the ED, by census date
  • ED Arrivals Shift 12A The number of patients arriving at the ED during the first 12-hour shift (7AM-7PM), by census date
  • ED Arrivals Shift 12B The number of patients arriving at the ED during the second 12-hour shift (7PM-7AM), by census date
  • ED Arrivals Shift 8A The number of patients arriving at the ED during the first 8-hour shift (7AM-3PM), by census date
  • ED Arrivals Shift 8B The number of patients arriving at the ED during the second 8-hour shift (3PM-11PM), by census date
  • ED Arrivals Shift 8C The number of patients arriving at the ED during the third 8-hour shift (11PM-7AM), by census date
  • ED Arrivals Today The number of patients arriving at the ED today, by census date
  • ED Arrivals Yesterday The number of patients arriving at the ED yesterday, by census date
  • ED Census The number of patients in the ED as of the beginning of a specific hour on a specific date
  • ED Census Admits The number of visits admitted through the ED that appear on the ED activity log, by census date
  • ED Census Admits Today The number of visits admitted through the ED that appear on the ED activity log today, by census date
  • ED Census Admits Yesterday The number of patients arriving at the ED yesterday, by census date
  • ED Census Holds The number of patients in the ED after a decision to admit and before departure, by census date
  • ED Census Hourly Avg The average number of patients in the ED by hour, by census date
  • ED Census LOS Avg The average elapsed time, in minutes, between arrival to the ED and the current hour for patients on the ED census as of that hour, by census date
  • ED Census LOS Avg Today The average elapsed time, in minutes, between arrival to and departure from the ED today, or current hour today if the patient has not departed the ED yet, by census date
  • ED Census LOS Avg Yesterday The average elapsed time, in minutes, between arrival to and departure from the ED today, or current hour today if the patient has not departed the ED yet, by census date
  • ED Census LOS Hrs Avg The average elapsed time, in minutes, between arrival to and departure from the ED today, or current hour today if the patient has not departed the ED yet, by census date
  • ED Census Max Daily The maximum census in the ED over a 24-hour period, by census date
  • ED Census Min Daily The maximum census in the ED over a 24-hour period, by census date
  • ED Census Shift 12A The minimum census in the ED over a 24-hour period, by census date
  • ED Census Shift 12A Avg The average hourly census in the ED during the first 12-hour shift (7AM-7PM), by census date
  • ED Census Shift 12A Begin The number of patients in the ED at the start of the first 12-hour shift (7AM-7PM), by census date
  • ED Census Shift 12A End The number of patients in the ED at the end of the first 12-hour shift (7AM-7PM), by census date
  • ED Census Shift 12B The number of patients in the ED during the second 12-hour shift (7PM-7AM), by census date
  • ED Census Shift 12B Avg The average hourly census in the ED during the second 12-hour shift (7PM-7AM), by census date
  • ED Census Shift 12B Begin The number of patients in the ED at the start of the second 12-hour shift (7PM-7AM), by census date
  • ED Census Shift 12B End The number of patients in the ED at the end of the second 12-hour shift (7PM-7AM), by census date
  • ED Census Shift 8A The number of patients in the ED during the first 8-hour shift (7AM-3PM), by census date
  • ED Census Shift 8A Avg The average hourly census in the ED during the first 8-hour shift (7AM-3PM), by census date
  • ED Census Shift 8A Begin The number of patients in the ED at the start of the first 7-hour shift (7AM-3PM), by census date
  • ED Census Shift 8A End The number of patients in the ED at the end of the first 8-hour shift (7AM-3PM), by census date
  • ED Census Shift 8B The number of patients in the ED during the second 8-hour shift (3PM-11PM), by census date
  • ED Census Shift 8B Avg The average hourly census in the ED during the second 8-hour shift (3PM-11PM), by census date
  • ED Census Shift 8B Begin The number of patients in the ED at the start of the second 8-hour shift (3PM-11PM), by census date
  • ED Census Shift 8B End The number of patients in the ED at the end of the second 8-hour shift (3PM-11PM), by census date
  • ED Census Shift 8C The number of patients in the ED during the third 8-hour shift (11PM-7AM), by census date
  • ED Census Shift 8C Avg The average hourly census in the ED during the third 8-hour shift (11PM-7AM), by census date
  • ED Census Shift 8C Begin The number of patients in the ED at the start of the second 8-hour shift (3PM-11PM), by census date
  • ED Census Shift 8C End The number of patients in the ED at the end of the third 8-hour shift (11PM-7AM), by census date
  • ED Census Today The number of patients in the ED today, by census date
  • ED Census Yesterday The number of patients in the ED yesterday, by census date
  • ED Cur Census Today The number of patients in the ED during today’s current hour, by census date
  • ED Cur Census Yesterday The number of patients in the ED yesterday at today’s current hour, census date
  • ED Cur Holds Today The number of patients in holding in the ED who have not departed, in the current hour today, by census date
  • ED Cur Holds Yesterday The number of patients in holding in the ED who have not departed, in the current hour yesterday, by census date
  • ED Cur LOS Today The average elapsed time, in minutes, between arrival to the ED and today’s current hour for patients who have not departed the ED, by census date. This measure is used in conjunction with the ED hourly census.
  • ED Cur LOS Yesterday The average elapsed time, in minutes, between arrival to the ED and yesterday at today’s current hour for patients who had not departed the ED, by census date
  • ED Departures The number of patients departing the ED for any reason including admission, by census date
  • ED Departures (Hrly) The number of patients departing the ED for any reason including admission, during a specific hour on a specific census date
  • ED Departures Shift 12A The number of patients departing the ED during the first 12-hour shift (7AM-7PM), by census date
  • ED Departures Shift 12B The number of patients departing the ED during the second 12-hour shift (7PM-7AM), by census date
  • ED Departures Shift 8A The number of patients departing the ED during the first 8-hour shift (7AM-3PM), by census date
  • ED Departures Shift 8B The number of patients departing the ED during the second 8-hour shift (3PM-11PM), by census date
  • ED Departures Shift 8C The number of patients departing the ED during the third 8-hour shift (11PM-7AM), by census date
  • ED Departures Today The number of patients departing the ED as of the current hour today, by census date
  • ED Departures Yesterday The number of patients departing the ED yesterday as of the current hour today, by census date
  • ED Transfers In (Hrly) The number of patients transferring into an ED location during a specific hour on a specific census date
  • ED Transfers In Shift 12A The number of patients transferring into an ED location during the first 12-hour shift (7AM-7PM), by census date
  • ED Transfers In Shift 12B The number of patients transferring into an ED location during the second 12-hour shift (7PM-7AM), by census date
  • ED Transfers In Shift 8A The number of patients transferring into an ED location during the first 8-hour shift (7AM-3PM), by census date
  • ED Transfers In Shift 8B The number of patients transferring into an ED location during the second 8-hour shift (3PM-11PM), by census date
  • ED Transfers In Shift 8C The number of patients transferring into an ED location during the third 8-hour shift (11PM-7AM), by census date
  • ED Transfers In Today The number of patients transferring into an ED location through the current hour today, by census date
  • ED Transfers In Yesterday The number of patients transferring into an ED location yesterday through the current hour today, by census date
  • ED Transfers Out (Hrly) The number of patients transferring out of an ED location during a specific hour on a specific census date
  • ED Transfers Out Shift 12A The number of patients transferring out of an ED location during the first 12-hour shift (7AM-7PM), by census date
  • ED Transfers Out Shift 12B The number of patients transferring out of an ED location during the second 12-hour shift (7PM-7AM), by census date
  • ED Transfers Out Shift 8A The number of patients transferring out of an ED location during the first 8-hour shift (7AM-3PM), by census date
  • ED Transfers Out Shift 8B The number of patients transferring out of an ED location during the second 8-hour shift (3PM-11PM), by census date
  • ED Transfers Out Shift 8C The number of patients transferring out of an ED location during the third 8-hour shift (11PM-7AM), by census date
  • ED Transfers Out Today The number of patients transferring out of an ED location through the current hour today by census date
  • ED Transfers Out Yesterday The number of patients transferring out of an ED location yesterday through the today’s current hour by census date

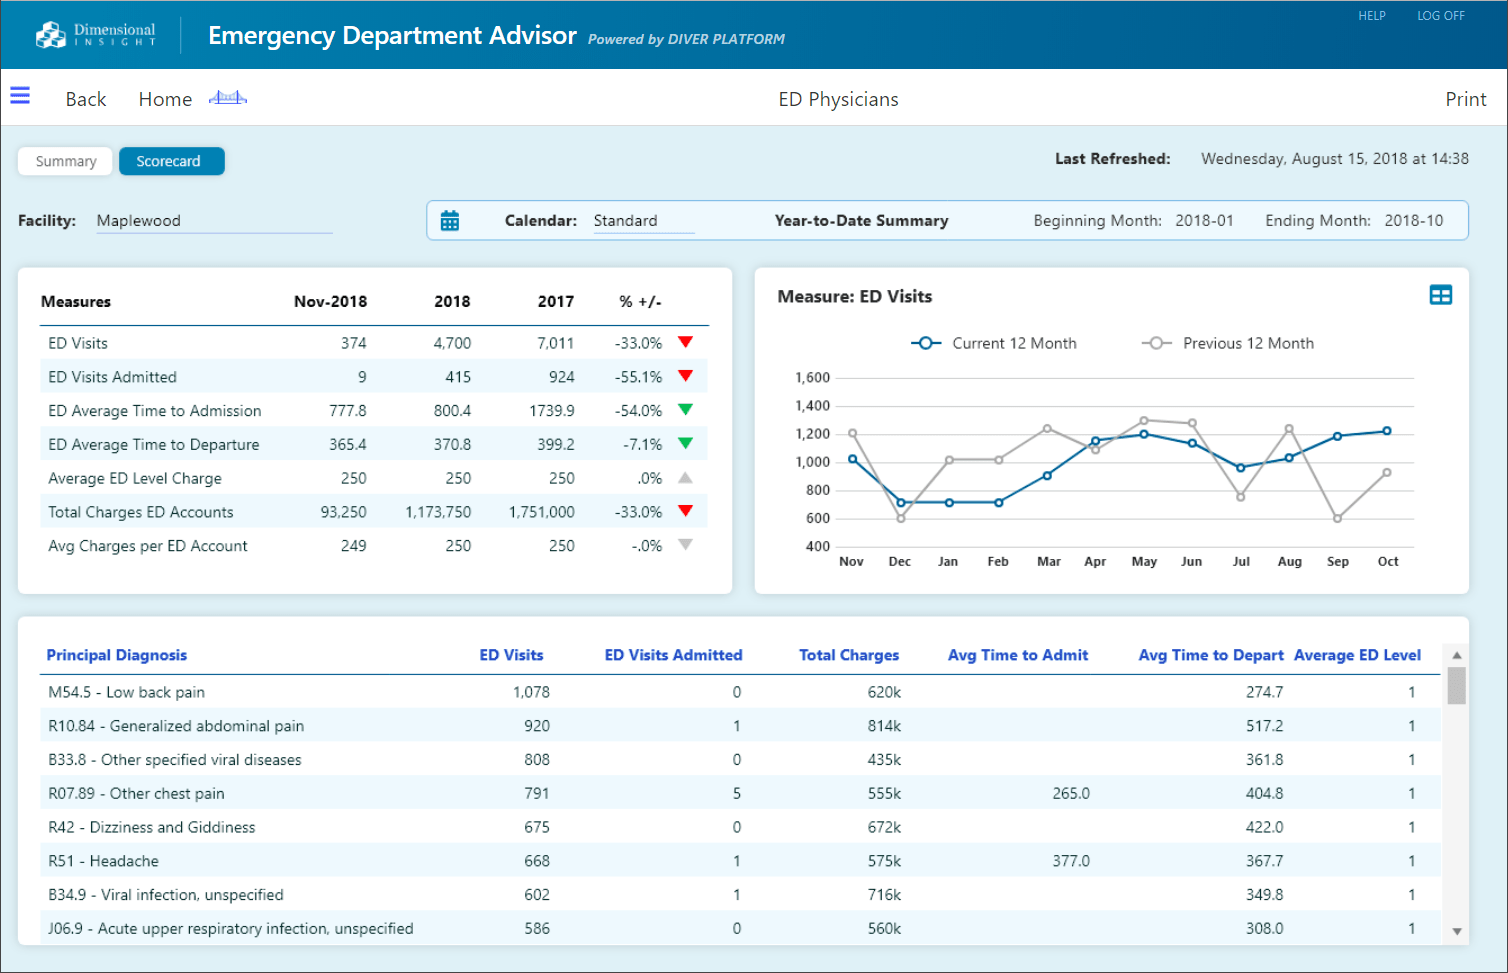
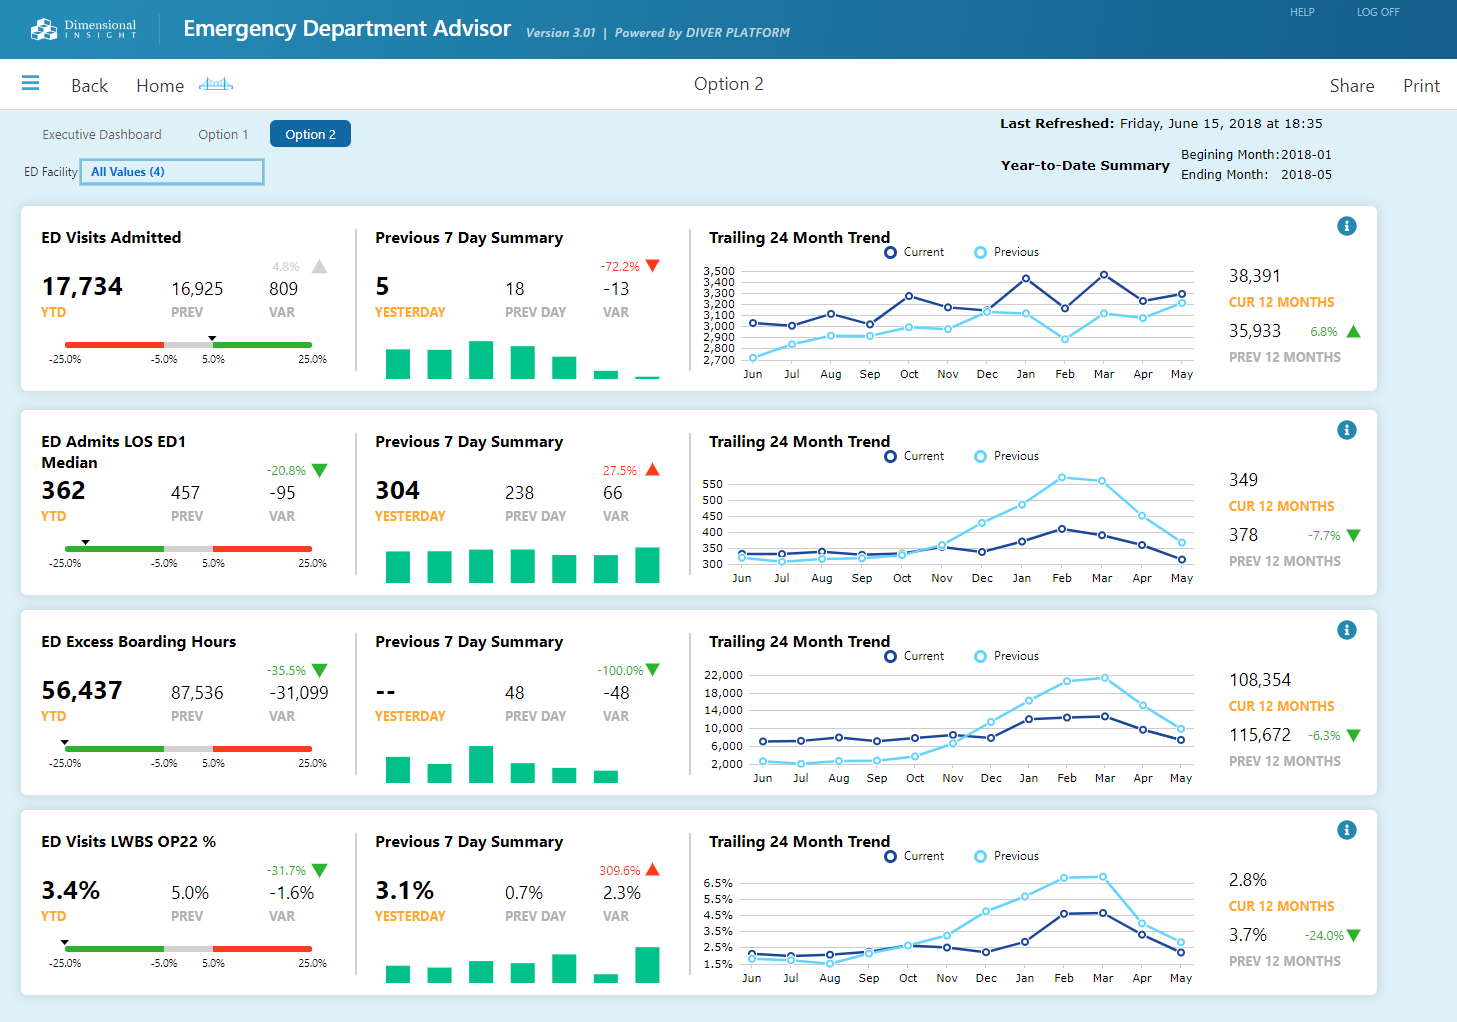
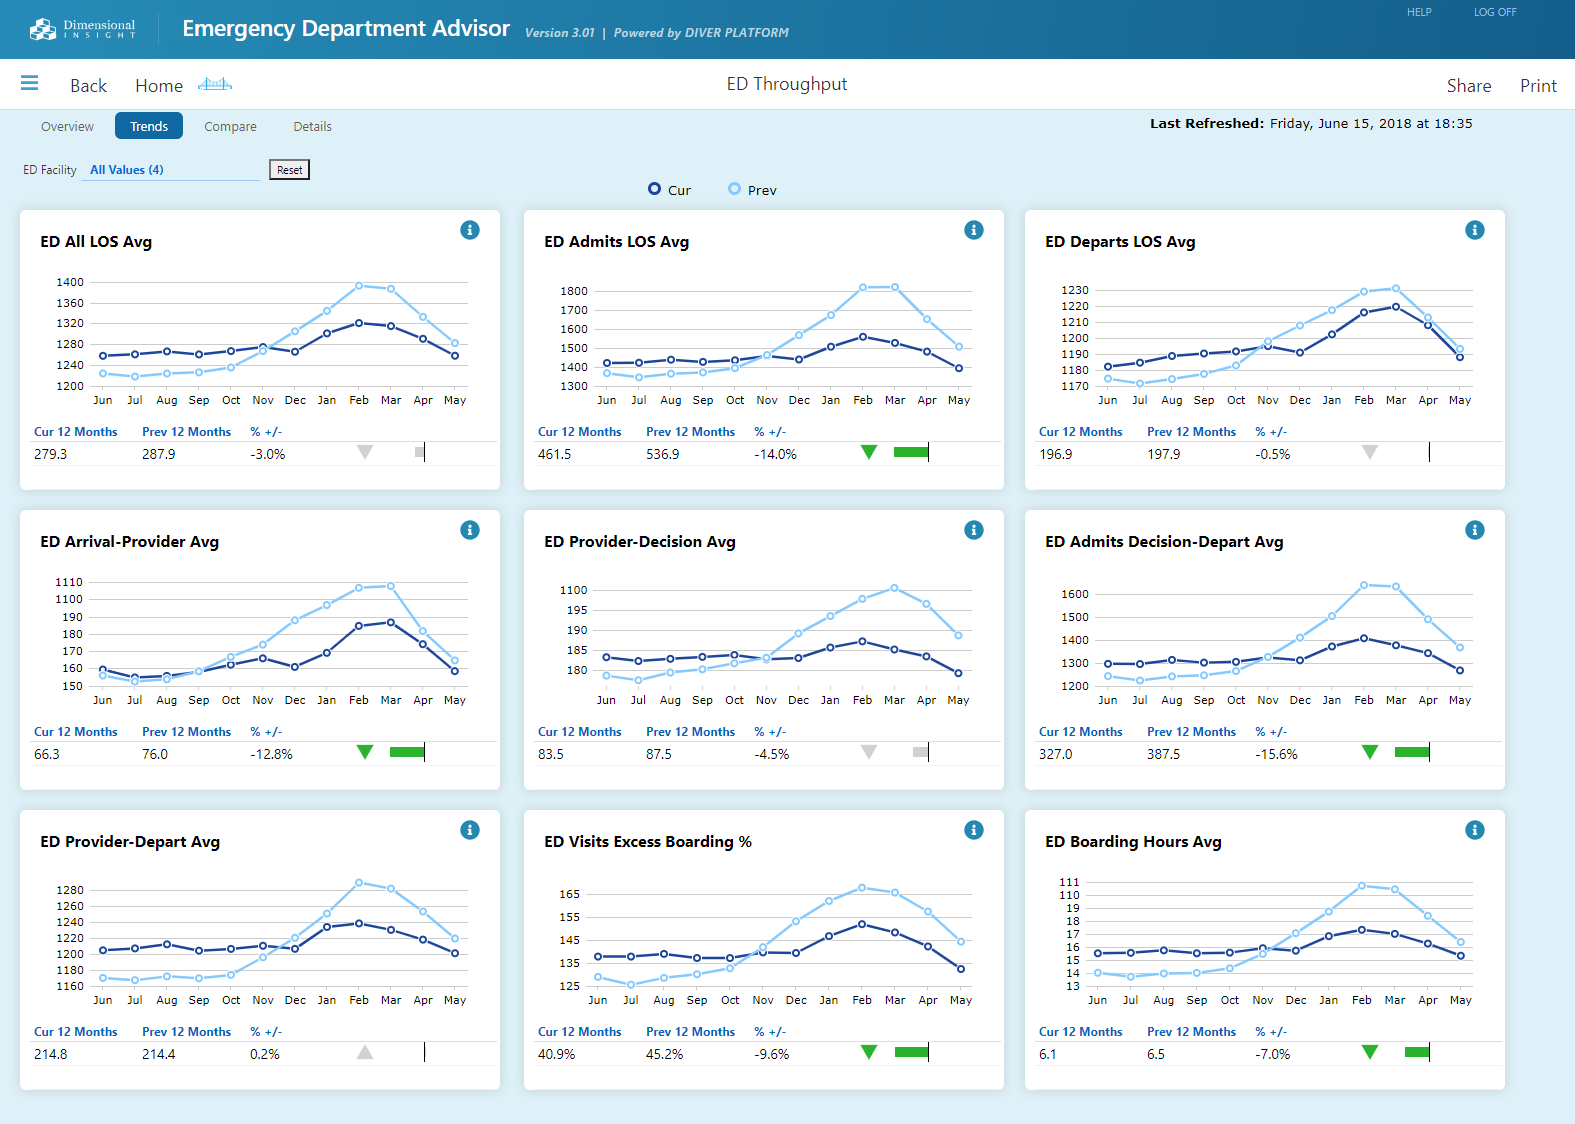
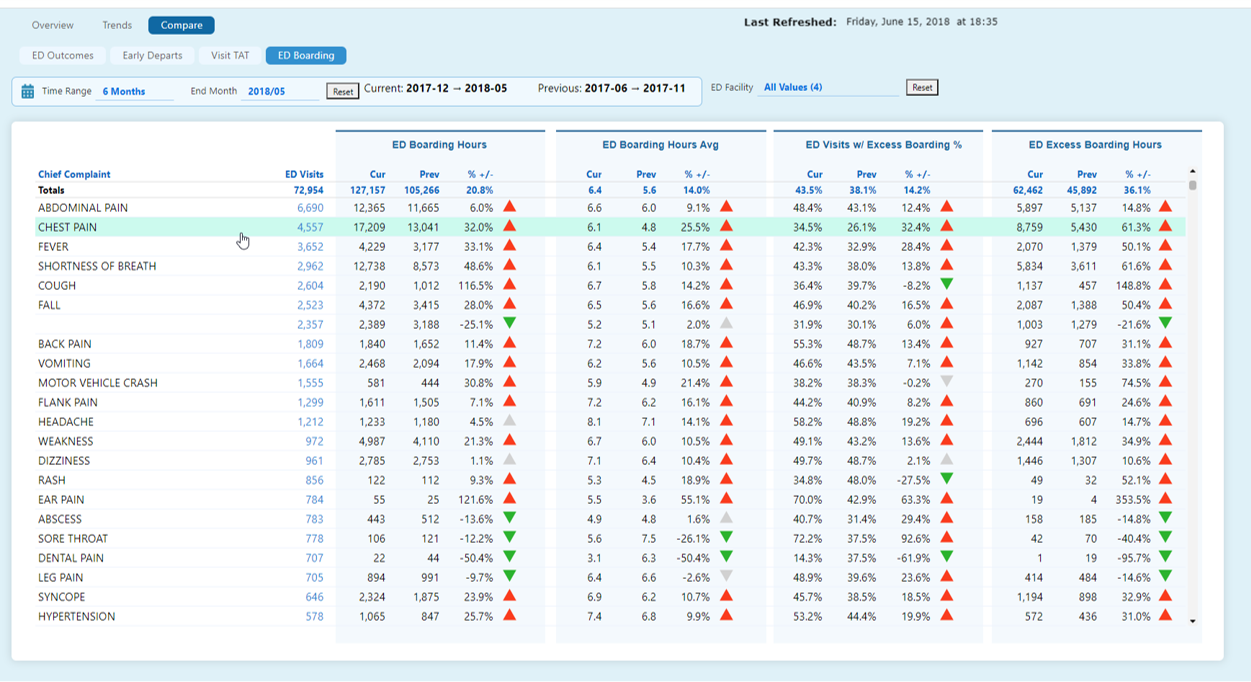
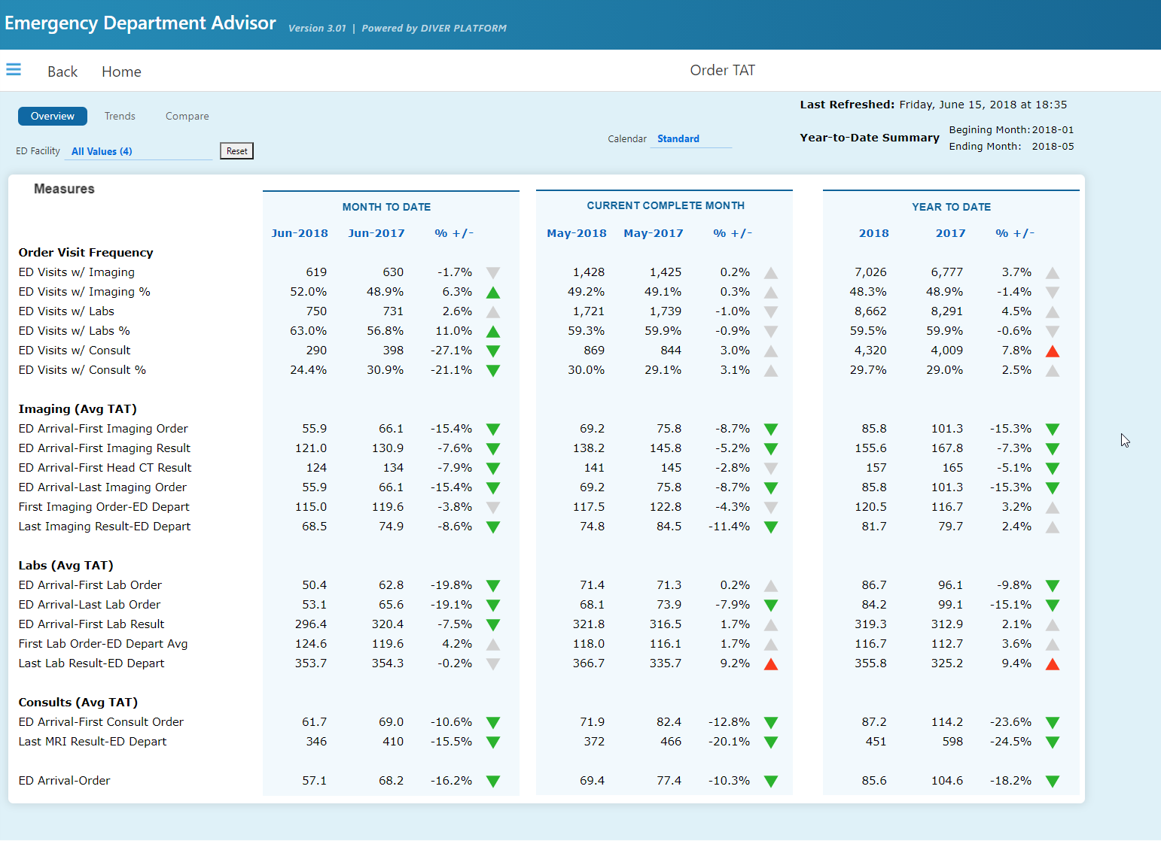
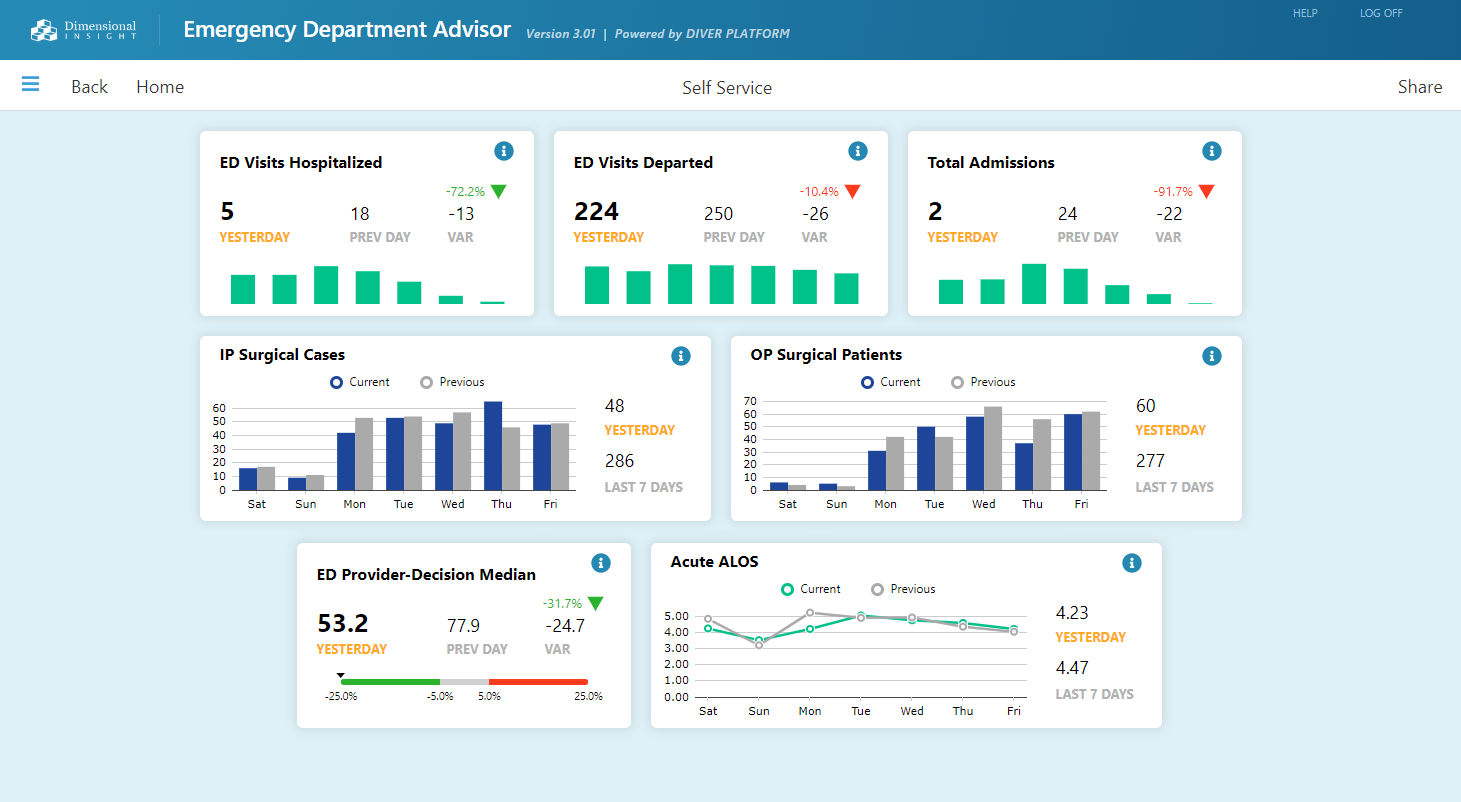
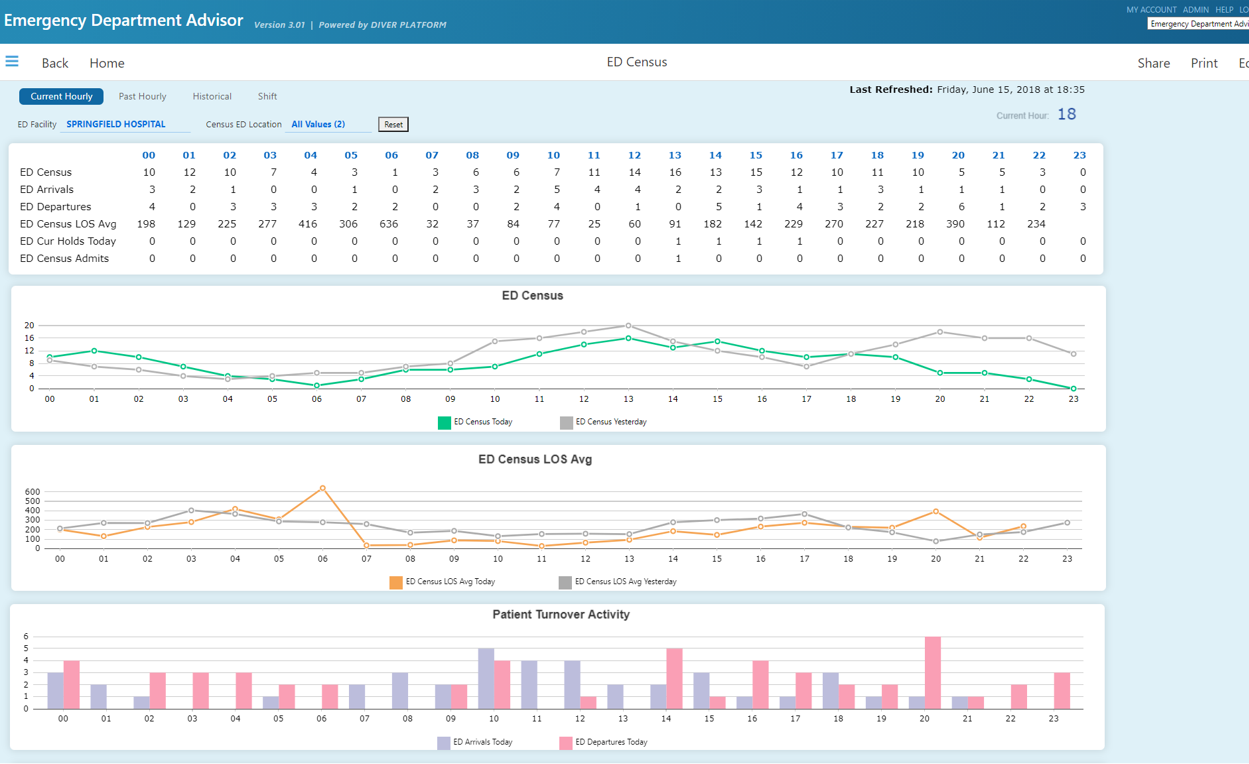
Examples of Emergency Department Advisor dashboards:

Emergency Department Advisor comes with a variety of off-the-shelf dashboard and reports. There is a consistent look and feel throughout both ED Advisor and also the rest of the Dimensional Insight Library of Applications.

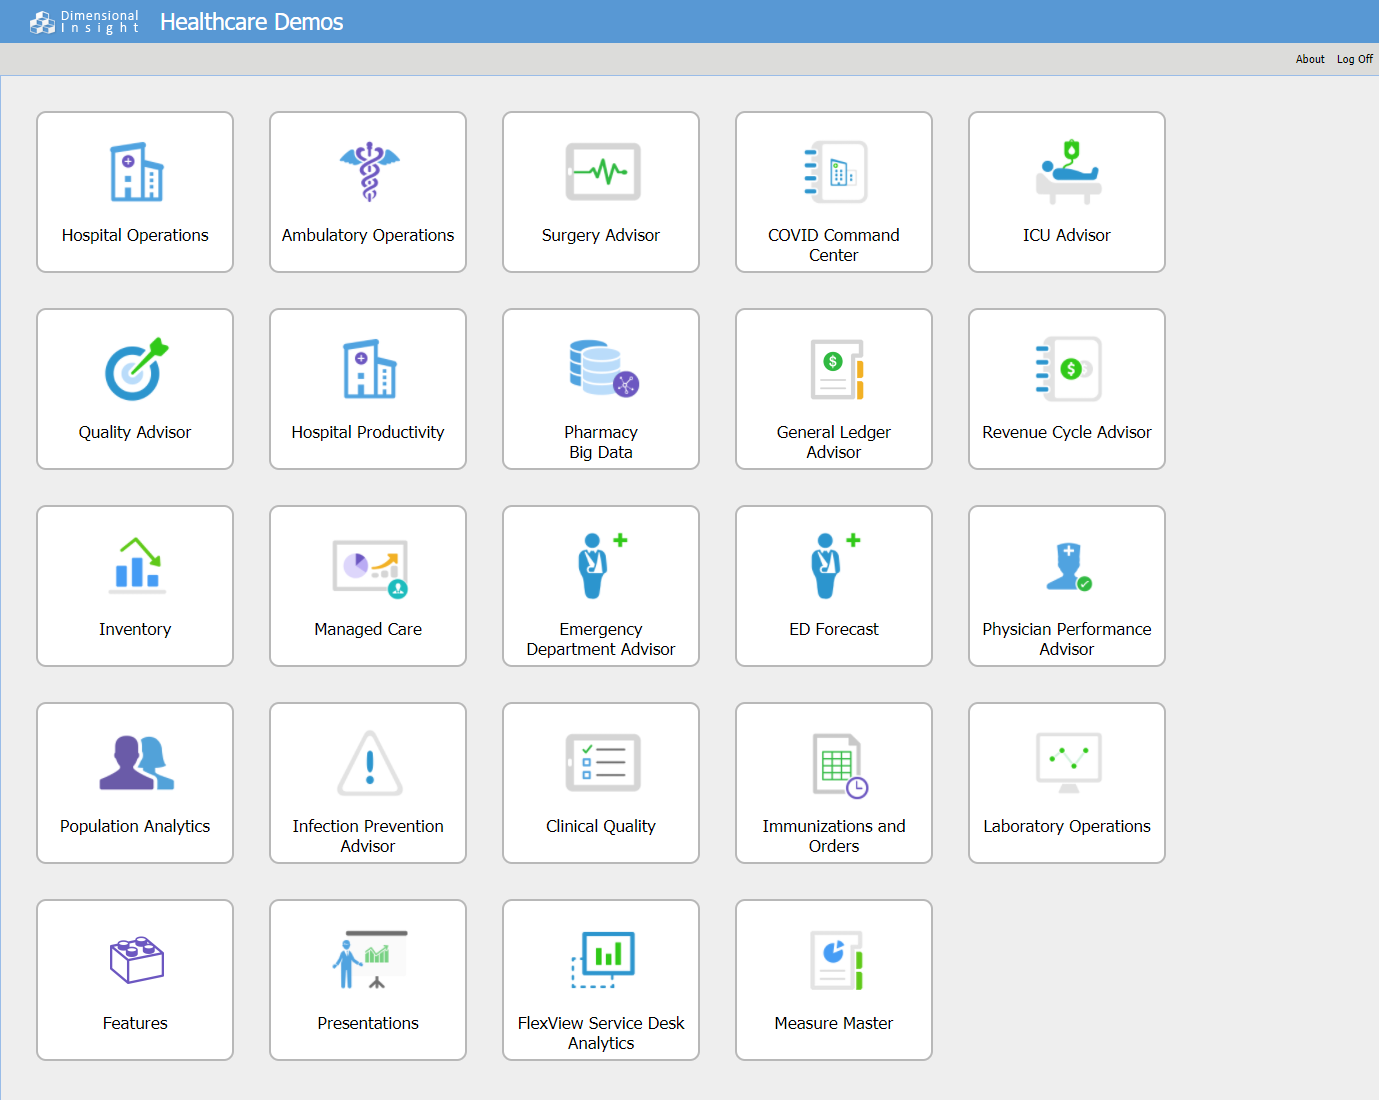
Part of Dimensional Insight’s Library of Applications

Emergency Department Advisor is built on Dimensional Insight’s enterprise analytics platform. Deploying these applications results in deep and sustained clinical, financial, and operational improvements that impact patient care and your organization’s bottom line. Diver Platform and Dimensional Insight’s Library of Applications satisfy your health system’s enterprise reporting needs.

Benefits to the Library of Applications approach

w

Data trust across departments

Data governance ensures the use of consistent, standardized, validated, and documented business rules and measures across applications. This means all departments are using the same definitions for decision-making.

}

Quick to implement

Dimensional Insight uses a proven process that leads to short implementation times and quick time to value. Applications build on previously implemented Dimensional Insight apps, leading to even shorter deployment times, especially when compared to department-specific apps from multiple vendors.

Lower overall costs

Because Dimensional Insight Applications are all built upon Diver Platform, hospitals do not incur the high costs associated with licensing and supporting solutions from multiple vendors.

Consistent look and feel across application areas

Applications all have a consistent, intuitive look and feel.  Moving from one application to another is seamless. Executives and other users do not have to learn several applications.

g

Designed to be customizable

Users access 1,000s of off-the-shelf industry-standard business rules that can be deployed “as is” or adjusted to your unique requirements.

Built on the award-winning, healthcare enterprise analytics platform: Diver Platform®

8 time Best in KLAS winner from 2010 to 2021

Our customers have perennially rated Diver Platform #1.

Leading edge technology

Enterprise analytics platform combines ETL, data management, and self-service analytics to provide a powerful engine that generates results for all types of users.

f

Data Governance

Rigorous processes that manage and protect data ensure data trust and consistency across the organization.

Custom development

Since Diver is a development platform, customers can modify existing Dimensional Insight applications or build new ones on their own.

Data when and where you want it

Users can easily access data from their desktop, laptop, tablet, or phone.

Multiple deployment options

Organizations can host deployment on site, in the cloud, or via SaaS.

Explore these resources for more information

Henry Mayo Newhall Hospital

Increasing Emergency Department Patient Throughput

Improve Emergency Department Efficiency & Revenue

Download data sheet

How to Improve the Performance of Your Emergency Department