Provider Advisor
Achieve compliance, improve practice patterns, and motivate physicians to excel.
Provider Advisor
Complete and timely views into physician performance
Provider Advisor, powered by the KLAS award-winning Diver Platform™, can help provide a consolidated view of physician performance. It also enables you to achieve compliance, improve practice patterns, and motivate physicians to excel.
Motivate Performance Improvements
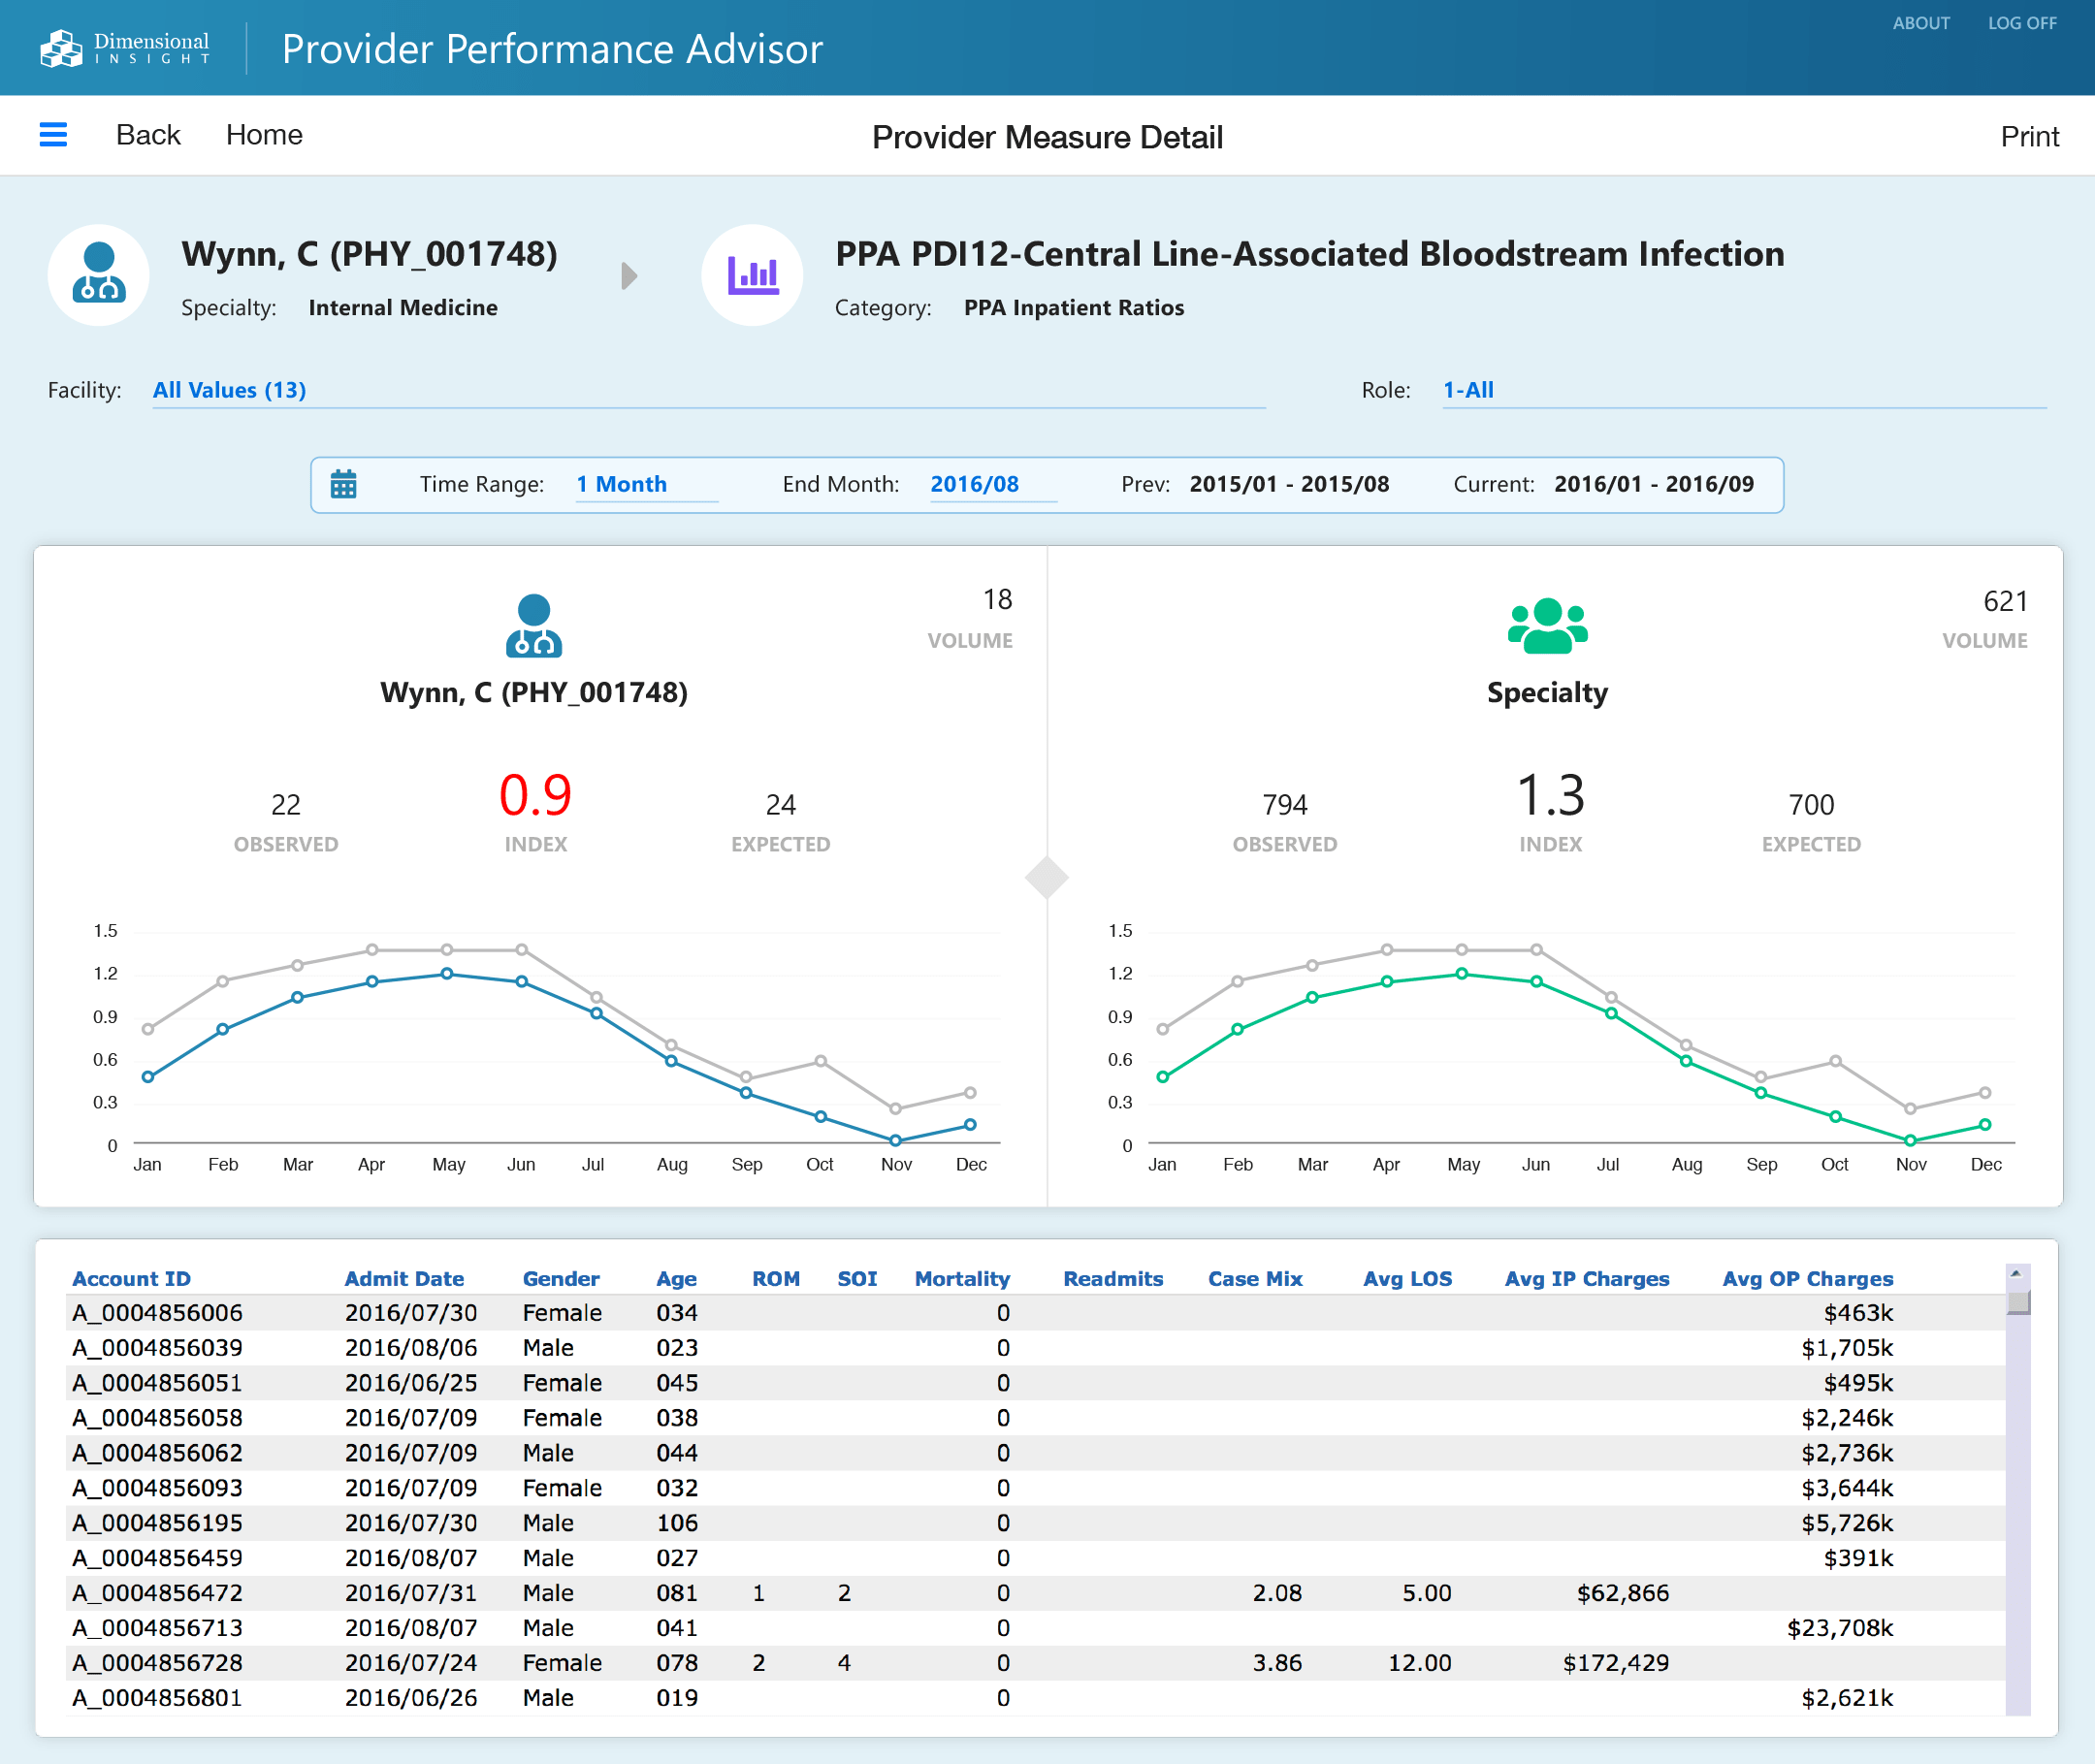
Motivating physicians to change behaviors requires that physicians trust the data used in their reviews. Provider Advisor enables the physician executive and physician to collaboratively review recent cases and dive from summary metrics to underlying details— down to the patient encounter level. The ability to filter by patient relationship—e.g., look only at attending physician roles—promotes constructive dialogue. And specific cases can be easily excluded, where warranted.
Monitor Physician Performance
Provider Advisor™ does more than just make it easier for you meet Joint Commission reporting requirements:
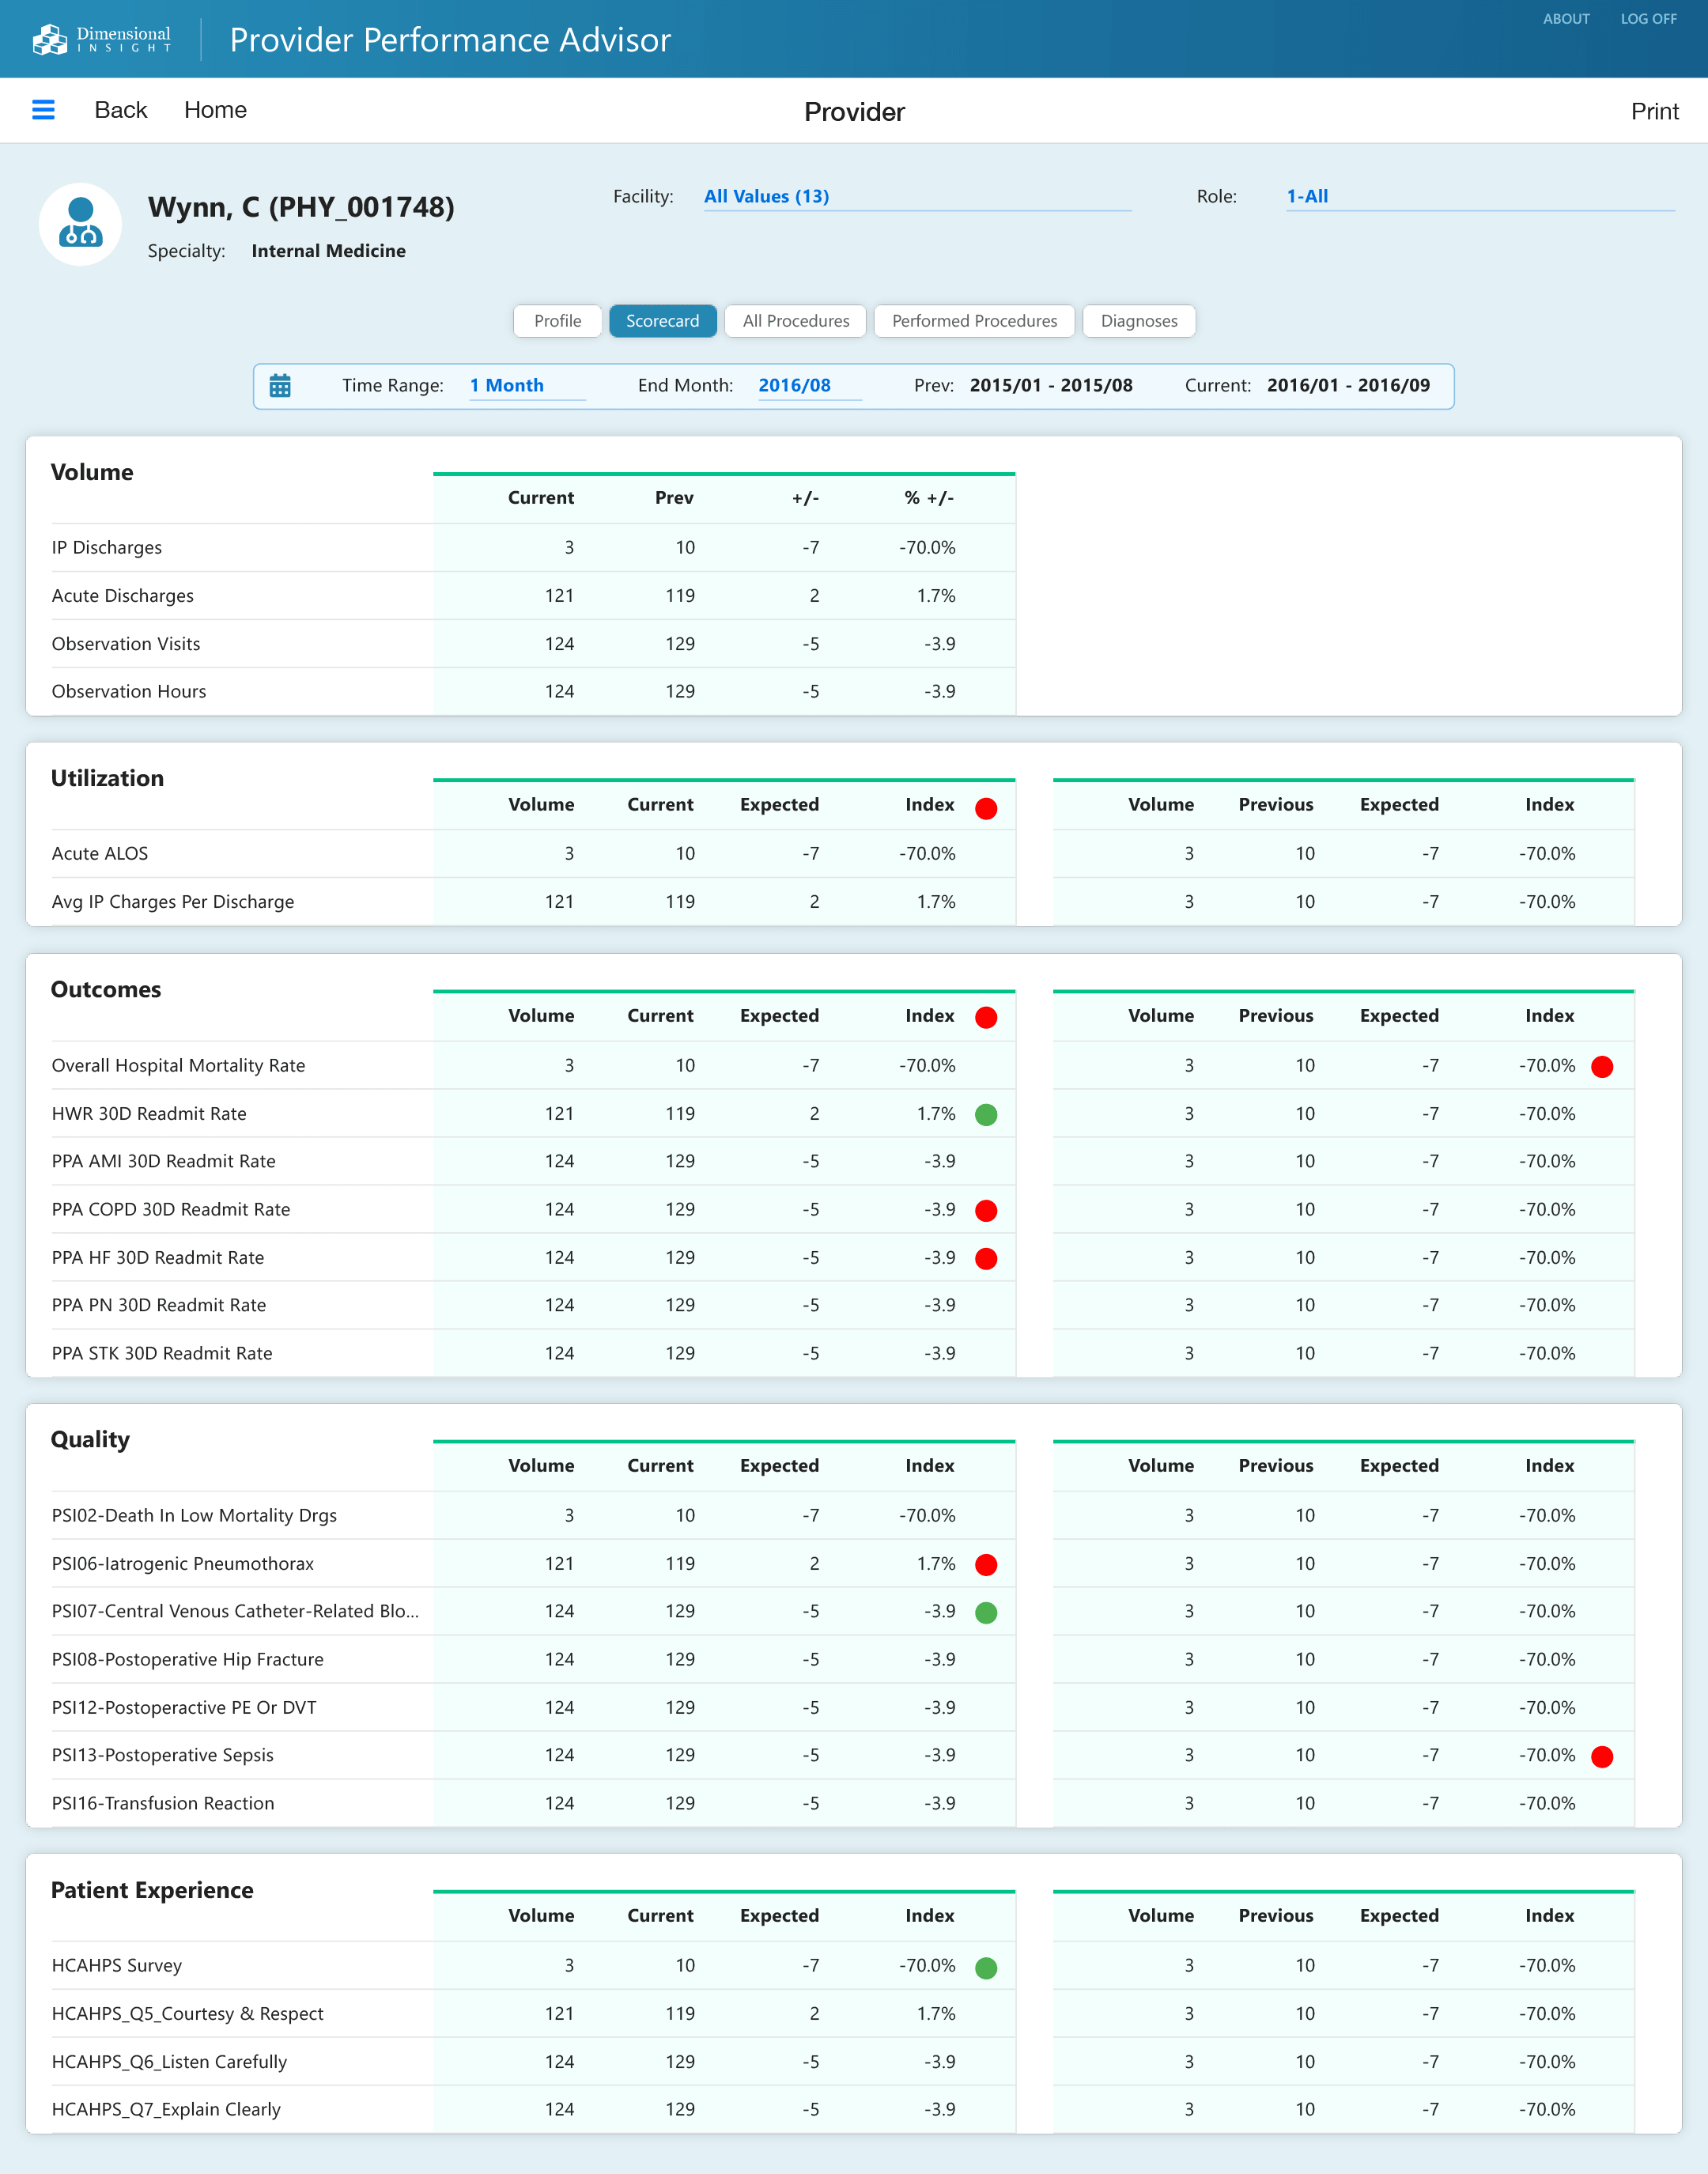
Display relevant metrics
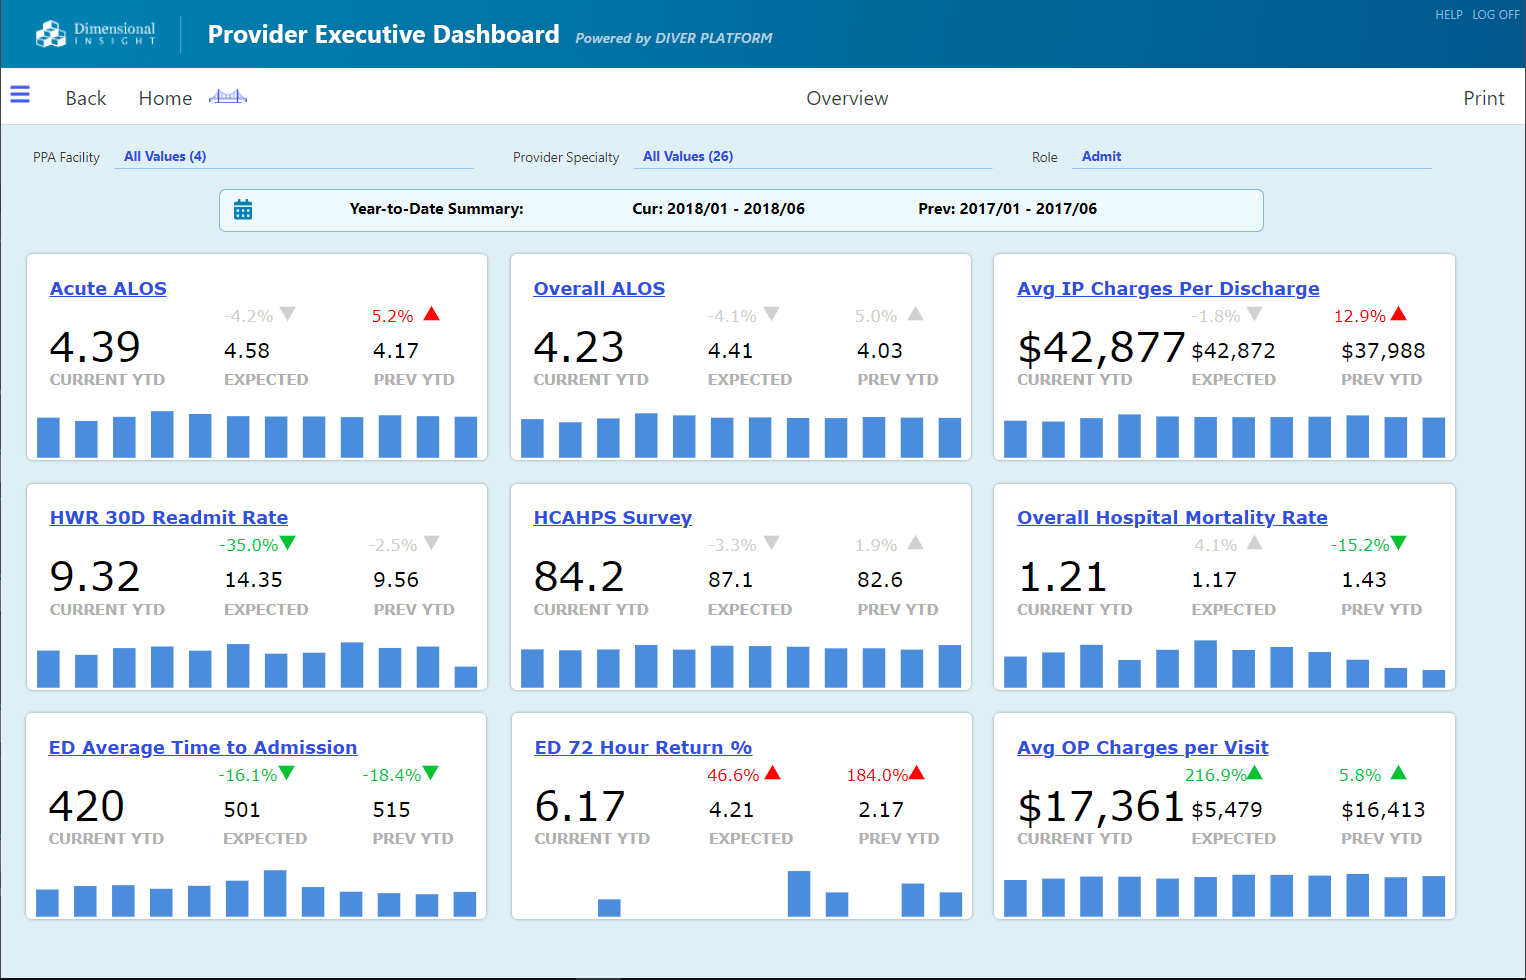
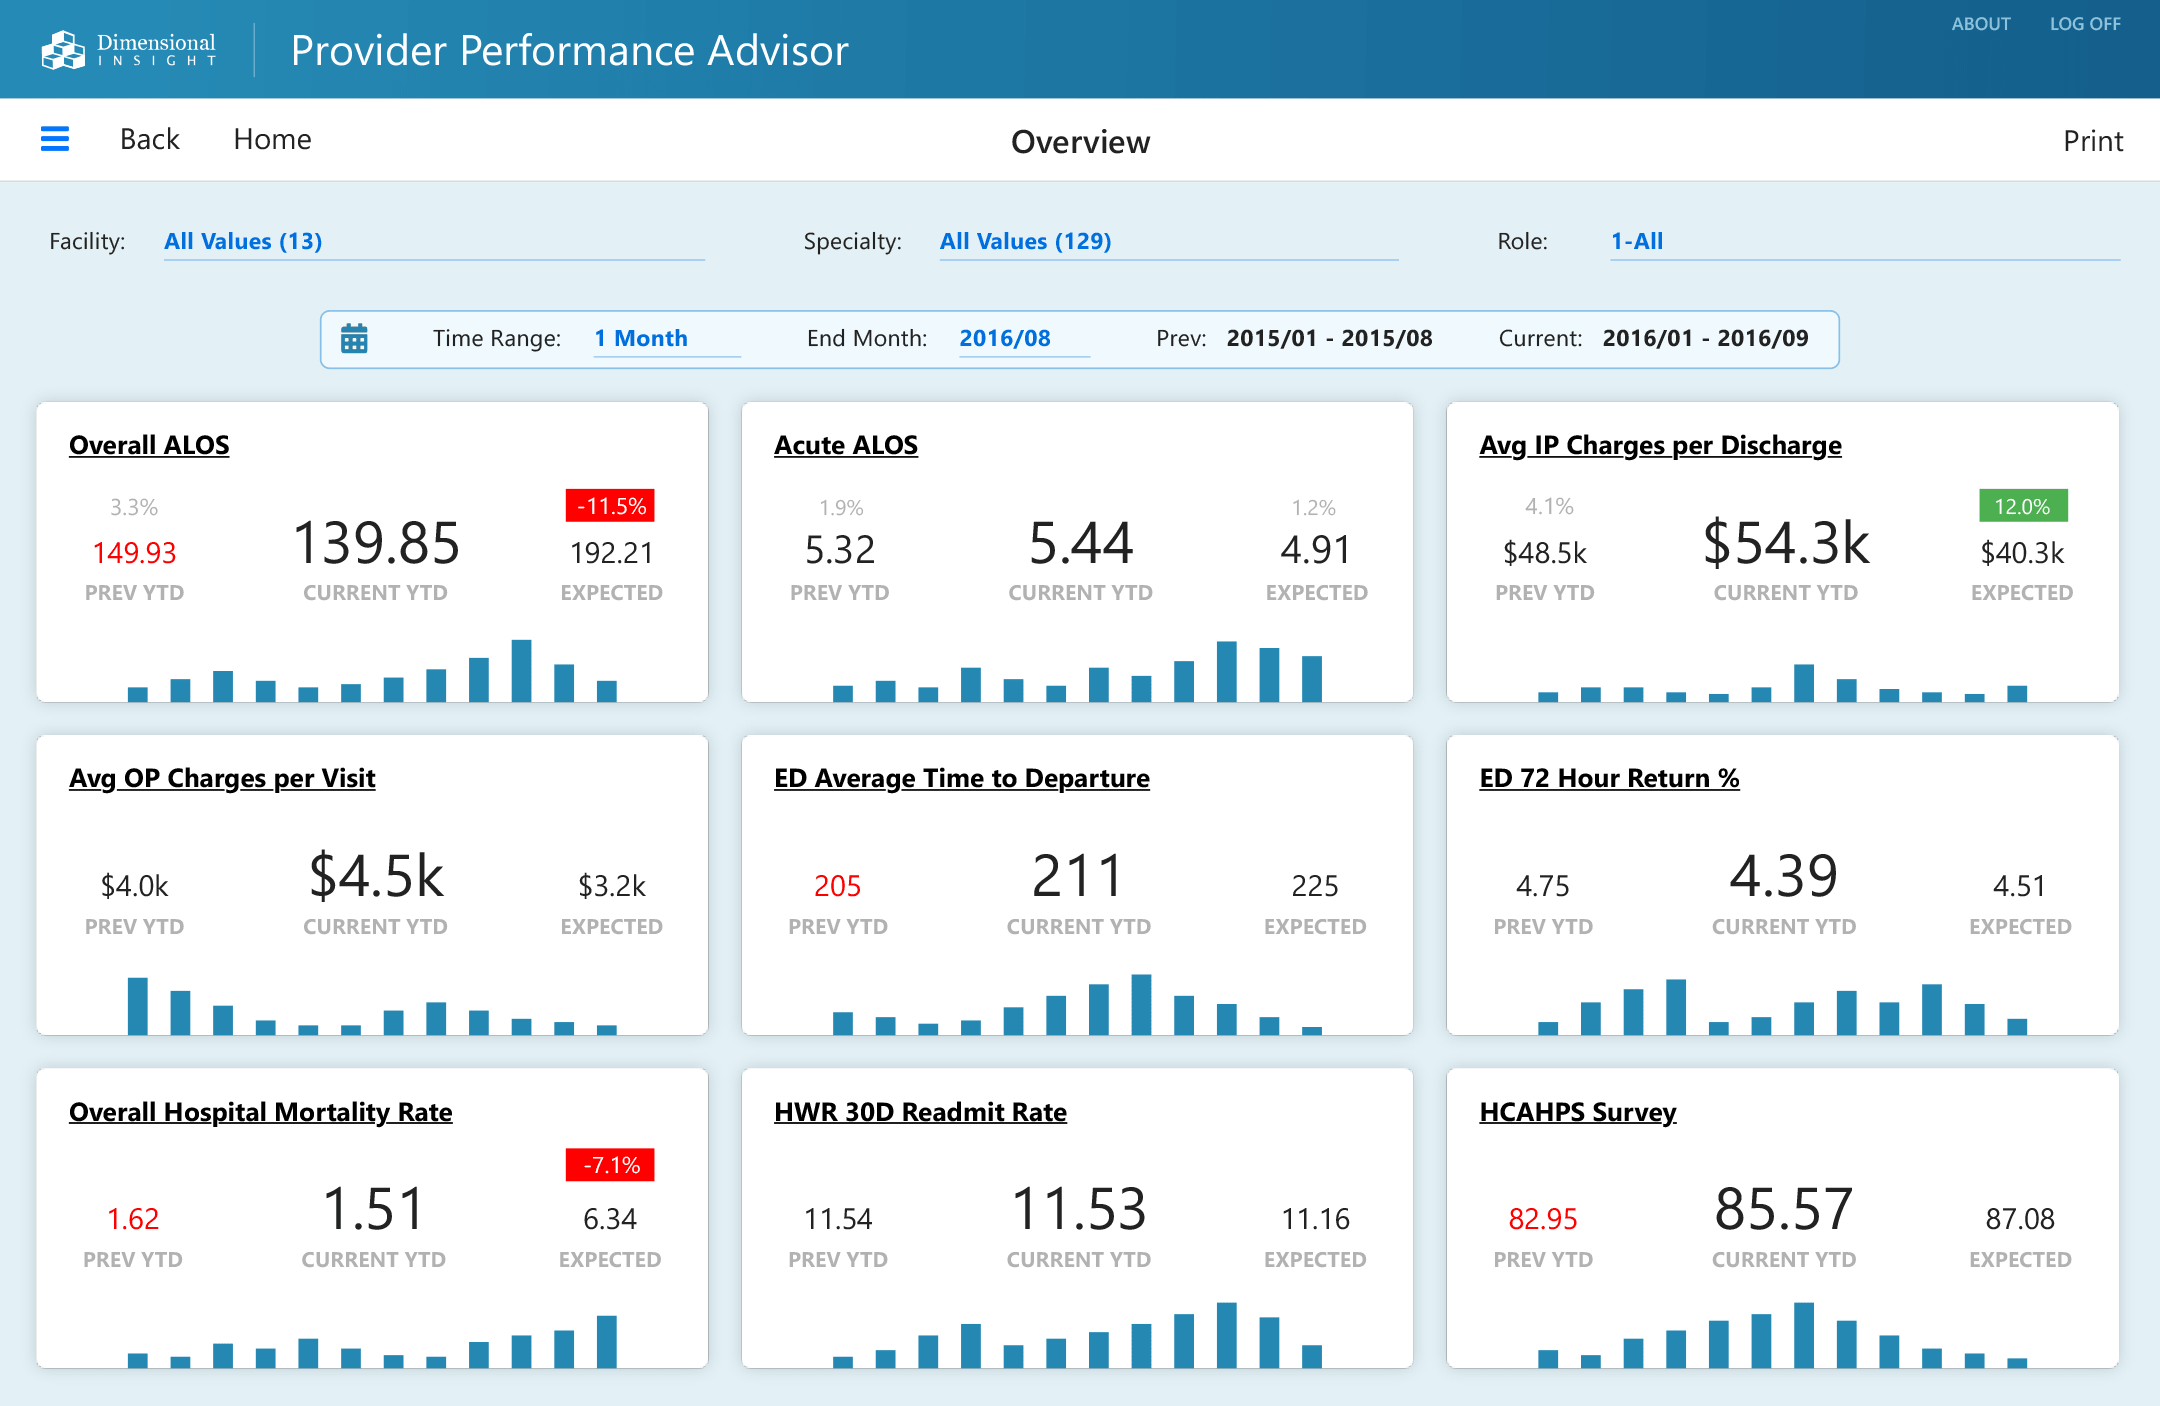
Display relevant metrics and benchmarks in concise dashboards to rapidly detect performance issues
Link to data
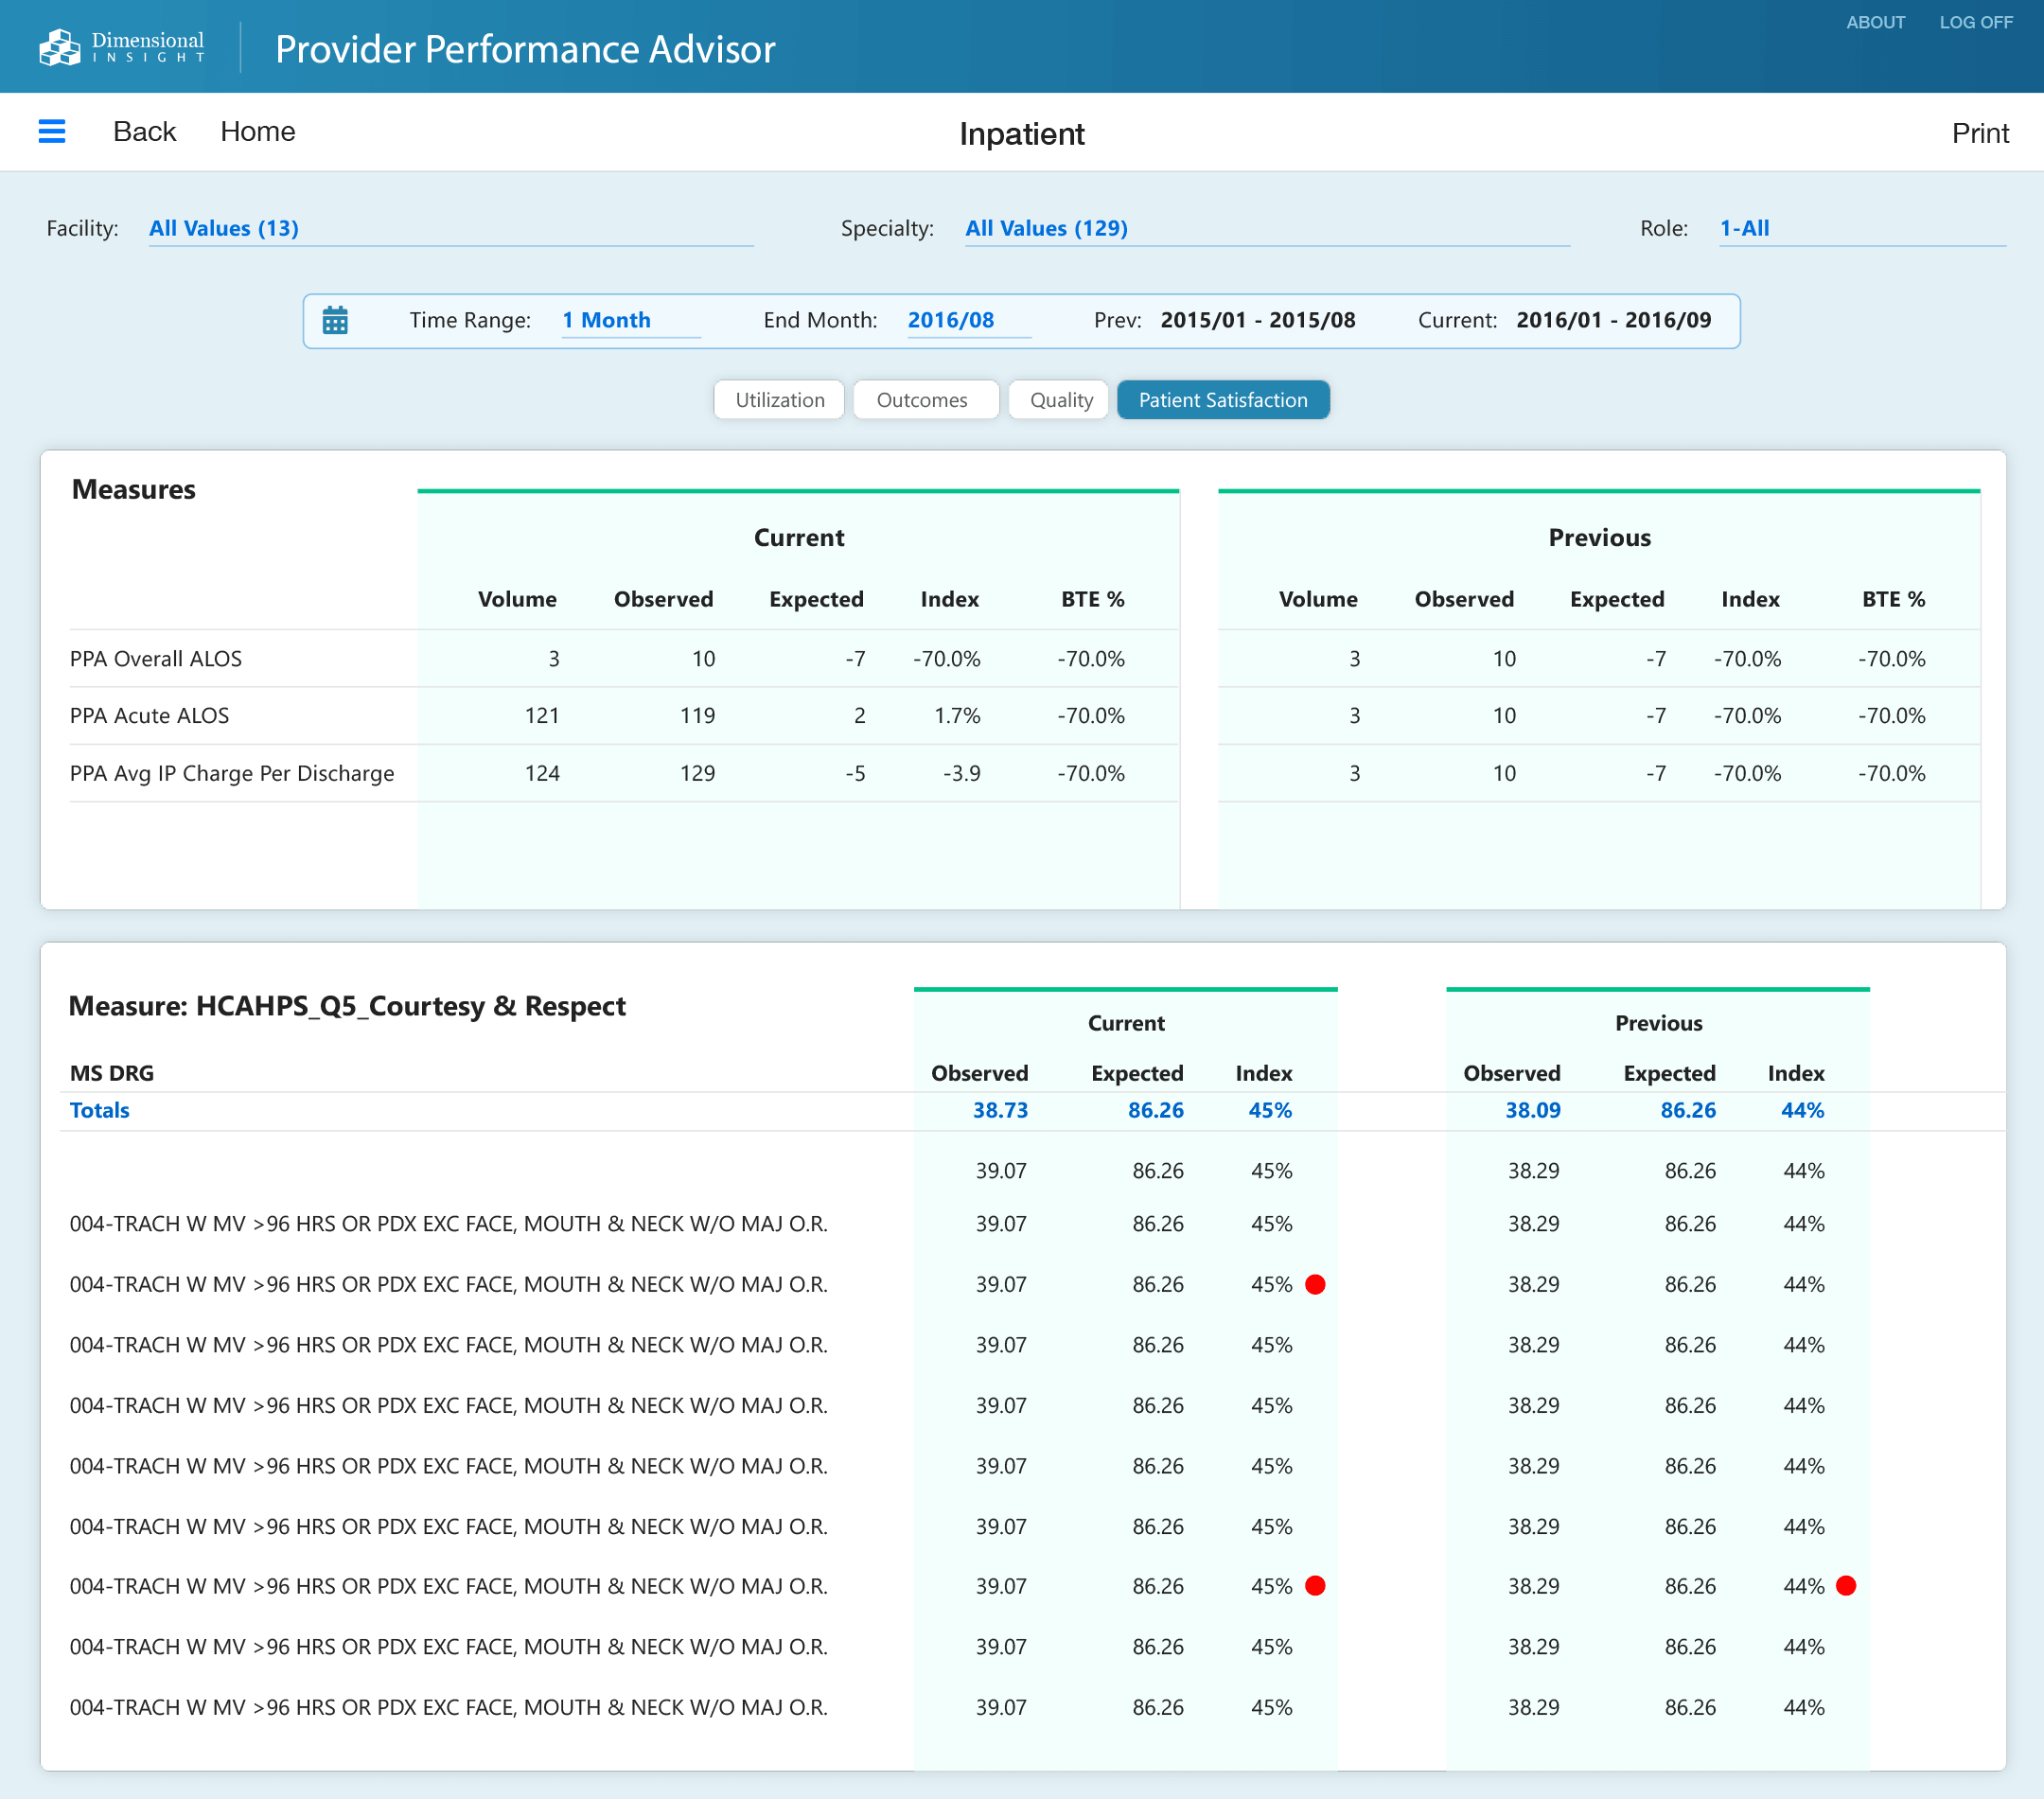
Link to data beneath individual physician and organizational performance
Facilitate re-credentialing
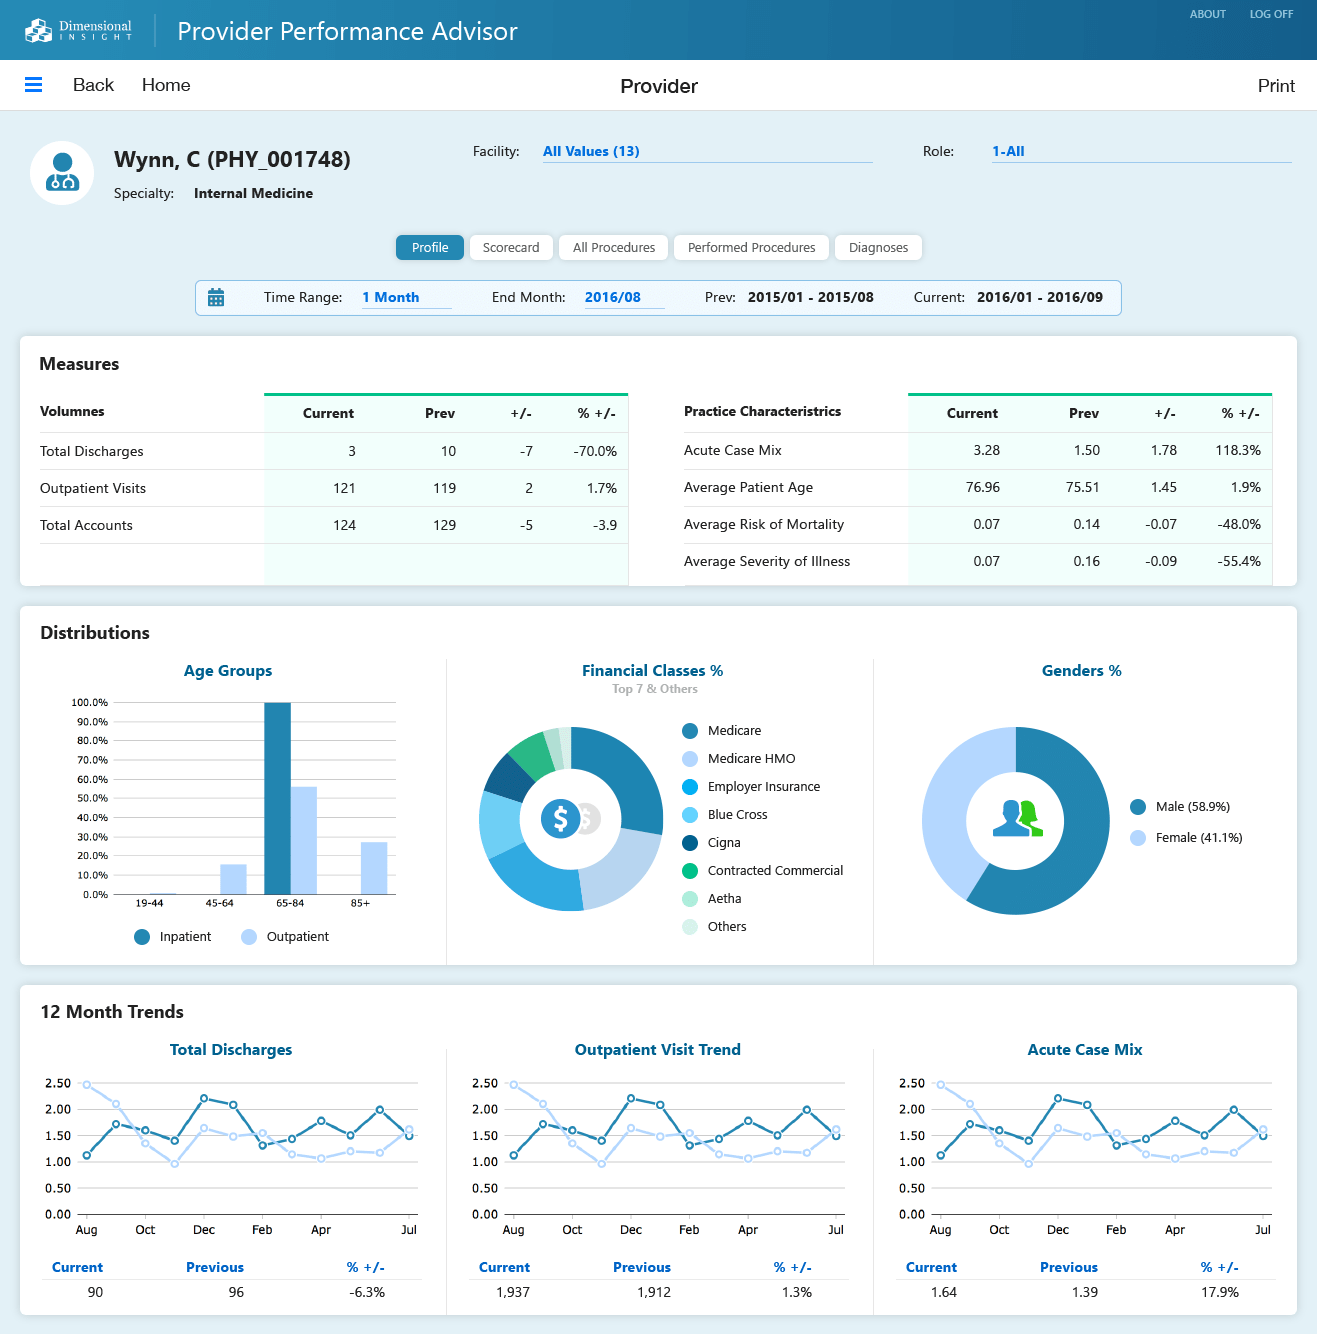
Facilitate re-credentialing with physician-specific views
Filter data
Filter data by care setting, visit type, and relationship to patient to ensure objectivity during physician reviews to better motivate improvements.
Monitor Physician Performance
Continuously monitor physician performance with 360-degree assessments of physician activity across multiple care settings and performance criteria.
Access to Industry Standard Out-of-the-Box Measures
The Provider Advisor application comes with out-of-the-box measures that can be quickly implemented in your hospital. Measures categories include:
Provider Inpatient Ratios
-
Acute All Payer Case Mix
-
Acute ALOS
-
Acute Discharge Days
-
Acute Discharges
-
Avg IP Charges Per Discharge
-
Avg OP Charges per Visit
-
HWR 30D Index Population
-
HWR 30D Indexes with Readmit
-
HWR 30D Readmit Rate
-
HWR 30D Readmits
-
HWR Index-Total Readmits
-
Inpatient Encounters
-
IP Surgical Cases
-
Overall All Payer Case Mix
-
Overall ALOS
-
Overall Hospital Mortality
-
Overall Hospital Mortality Rate
-
Total Charges
-
Total Discharge Days
-
Total Encounters
-
Total Surgical Cases
Provider Inpatient Volumes
-
Total Admissions
-
IP Admissions
-
Total Discharges
-
IP Discharges
Provider Outpatient Volumes
-
ED 72 Hour Index w/ Return
-
ED 72 Hour Return %
-
ED 72 Hour Returns w/ Admit
-
ED Average Length Of Stay Hour
-
ED Average Time to Departure
-
ED Return Index Pop
-
ED Visits
-
Observation Hours
-
Observation Visits
-
OP Surgical Cases
Provider Patient Satisfaction
-
HCAHPS Survey
-
HCAHPS_Q5_Courtesy & Respect
-
HCAHPS_Q6_Listen Carefully
-
HCAHPS_Q7_Explain Clearly
Provider Practice
- Average Patient Age
Provider Procedures
-
Inpatient Procedure
-
Outpatient Procedure
Provider Quality (AHRQ)
-
IQI21-Cesarean Delivery Rate
-
IQI22-Vaginal Birth After Cesarean (VBAC) Rate
-
IQI23-Laparoscopic Cholecystectomy Rate
-
IQI24-Incidental Appendectomy In The Elderly Rate
-
IQI33-Primary Cesarean Delivery Rate
-
IQI34-Vaginal Birth After Cesarean (VBAC) Rate
-
NQI01-Iatrogenic Pneumothorax In Neonates
-
NQI02-Neonatal Mortality Neonatal Mortality
-
NQI03-Blood Stream Infections In Neonates
-
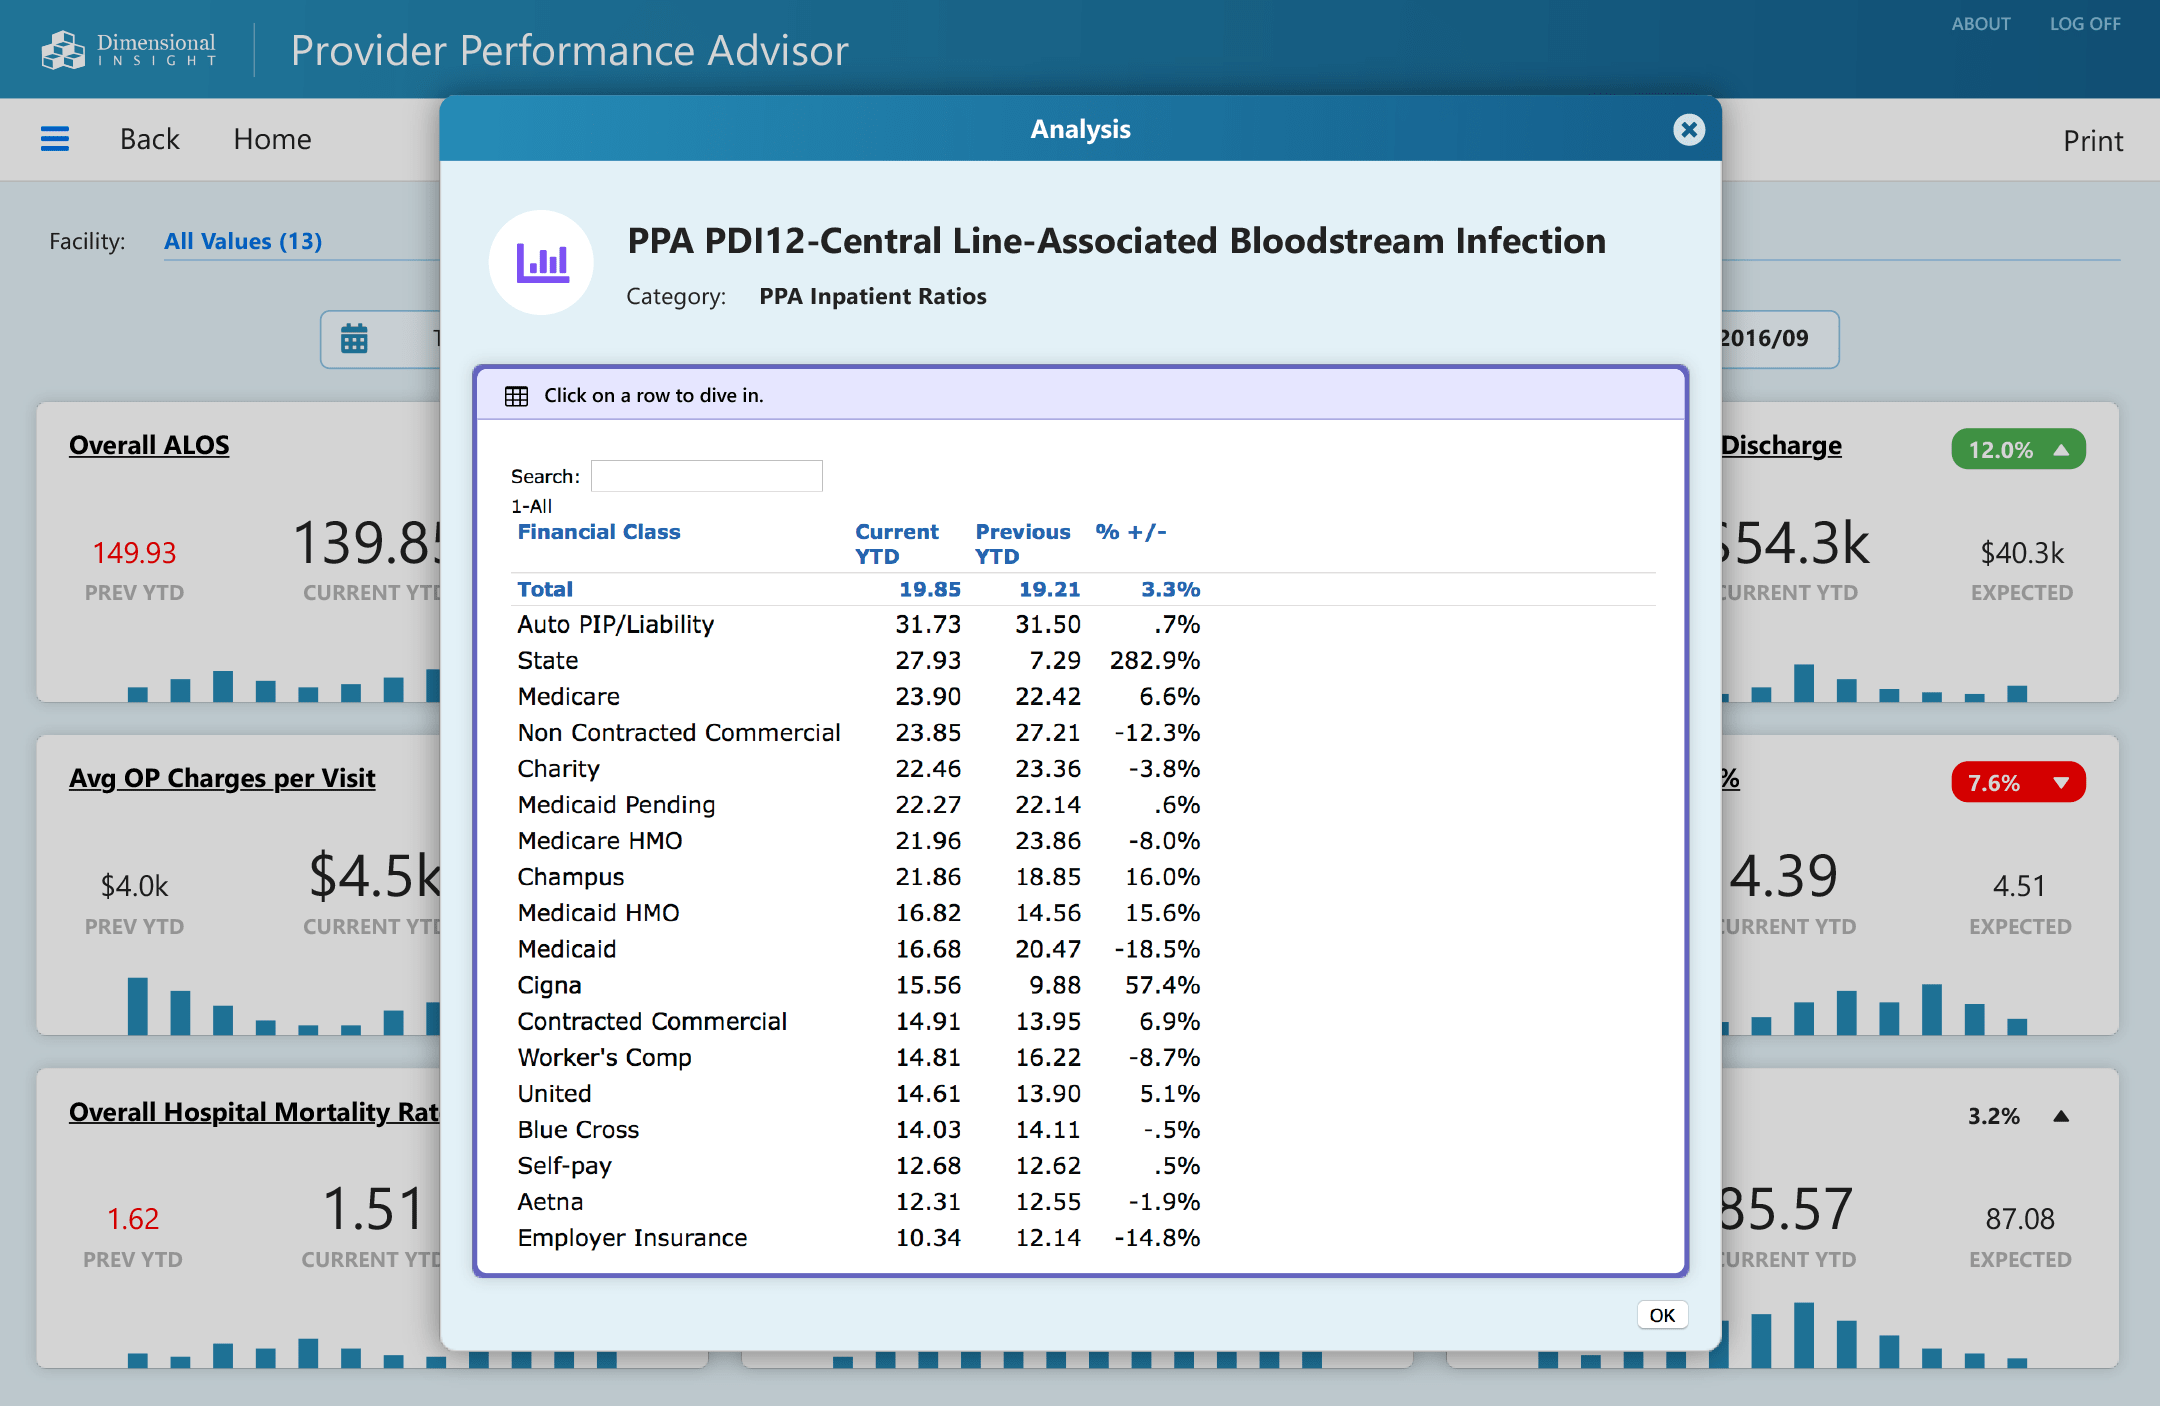
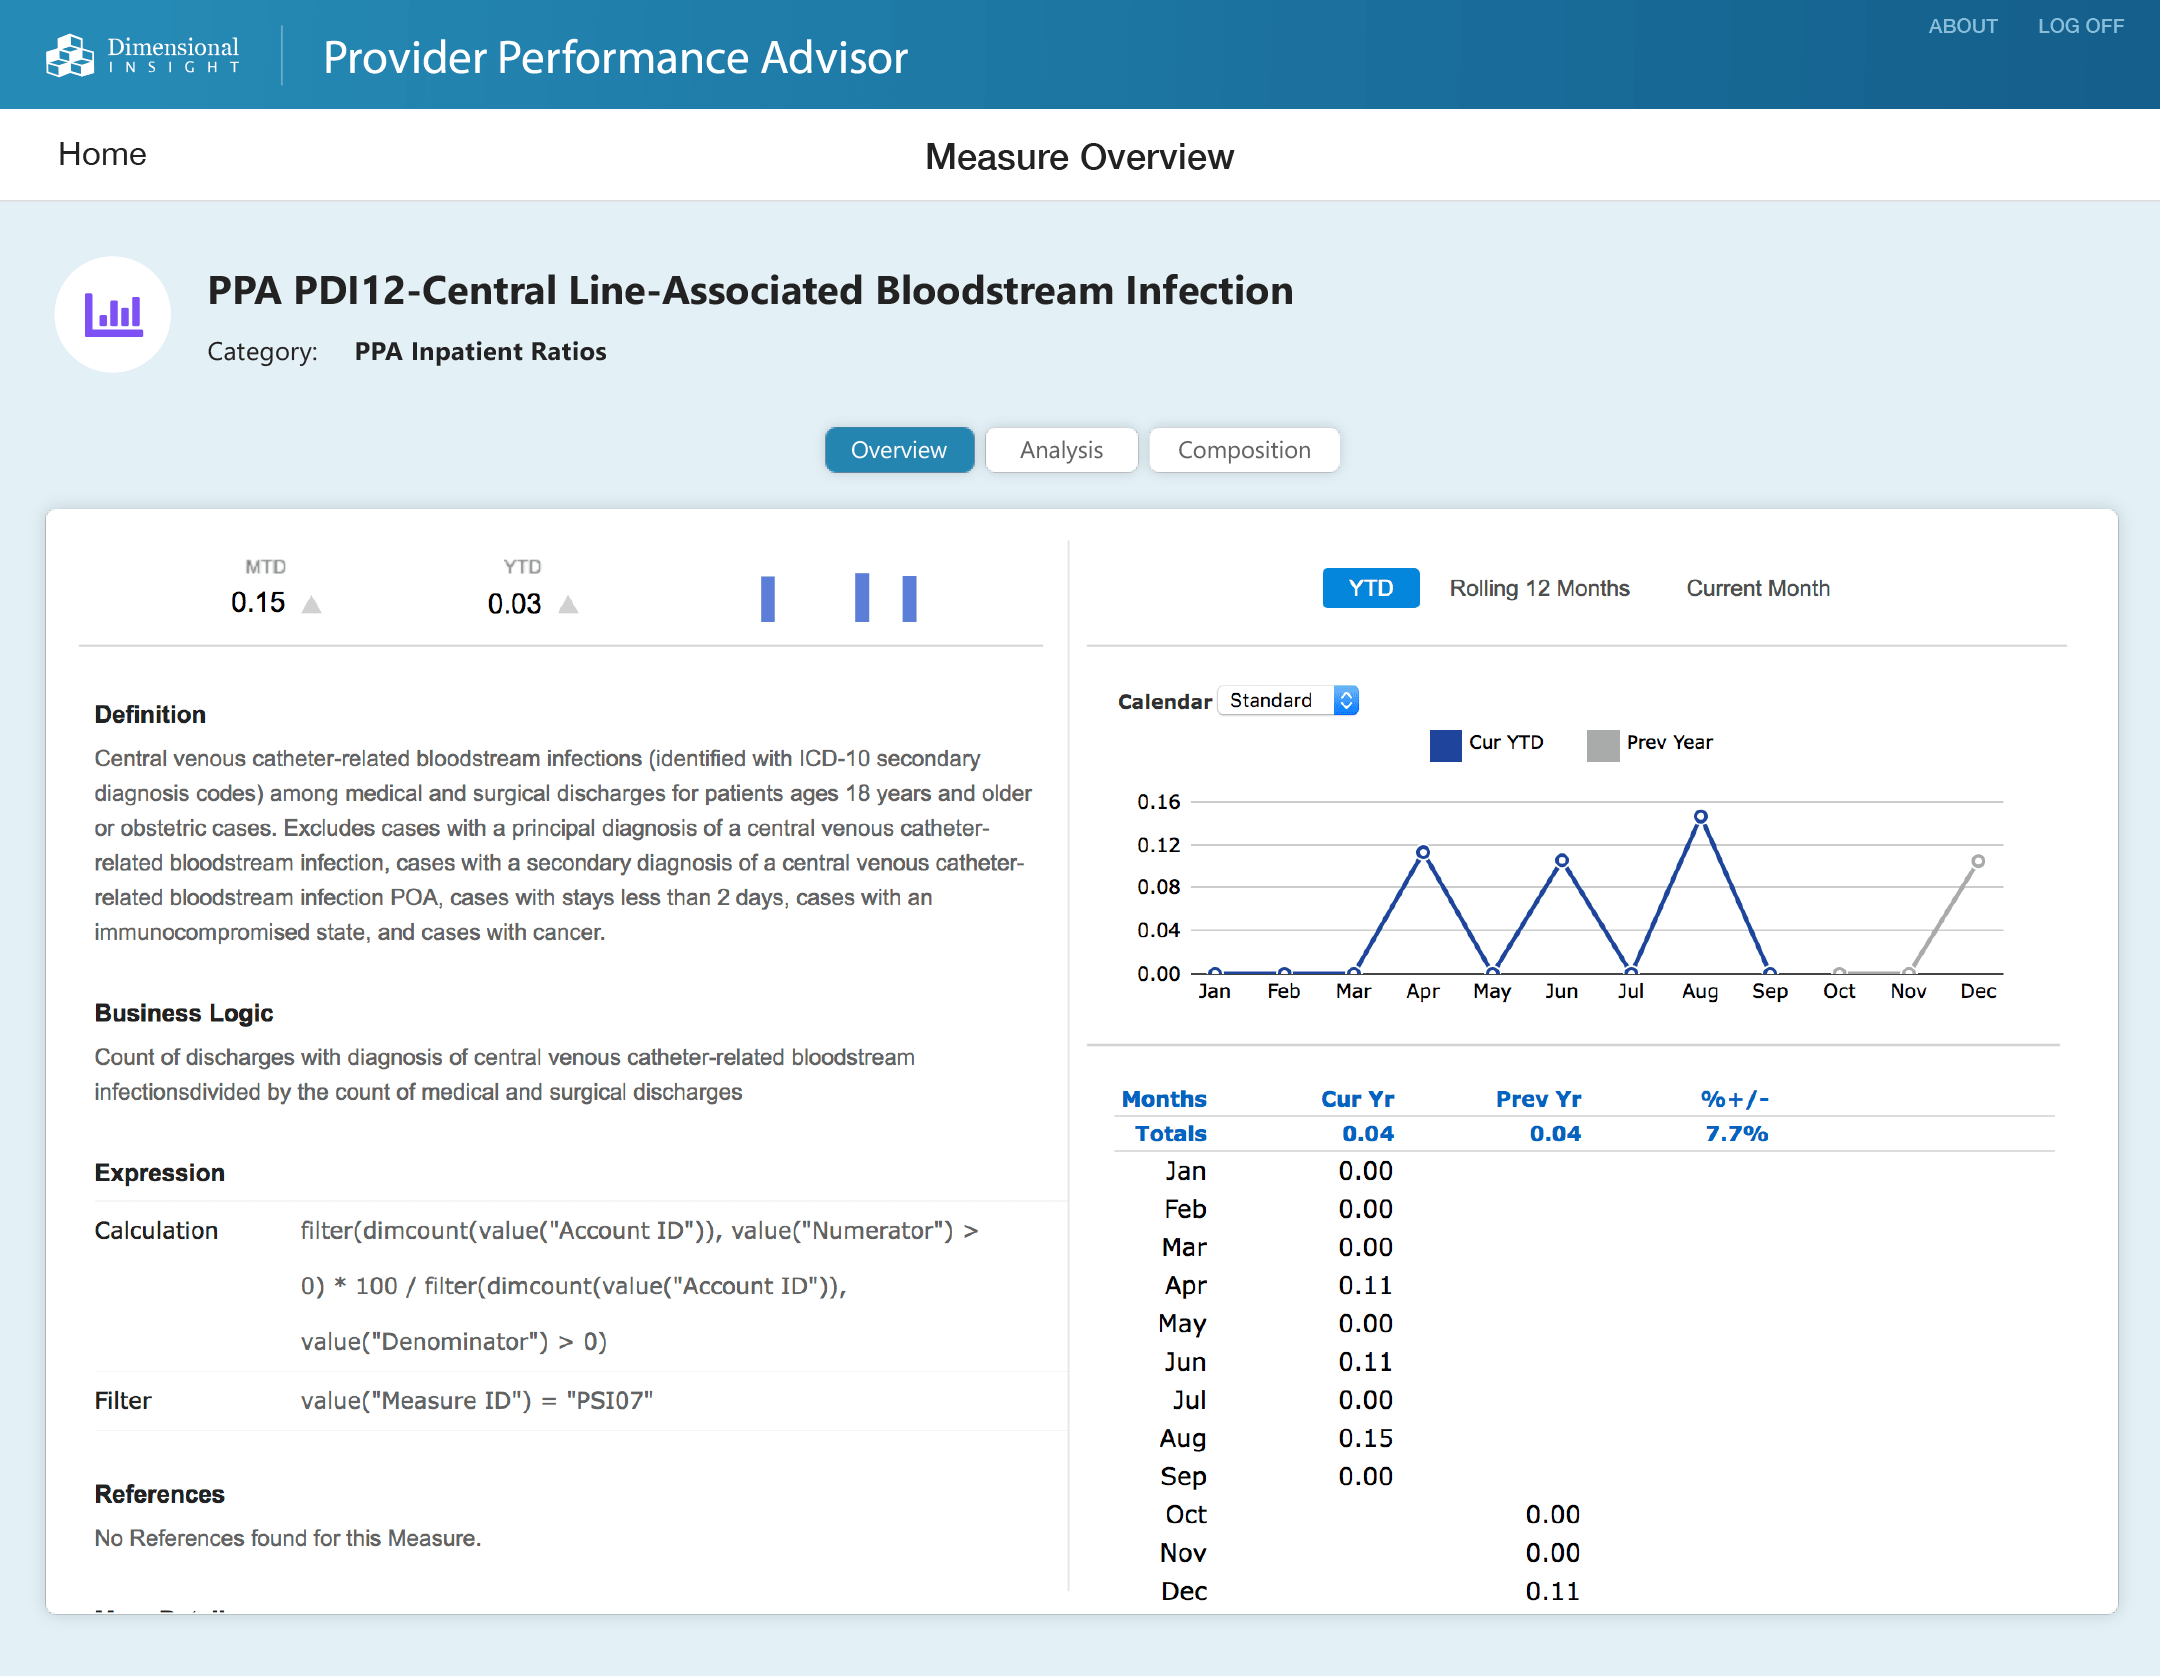
PDI12-Central Line-Associated Bloodstream Infection
-
PDI13-Transfusion Reaction
-
PSI02-Death In Low Mortality Drgs
-
PSI03-Pressure ulcer
-
PSI06-Iatrogenic Pneumothorax
-
PSI07-Central Venous Catheter-Related Bloodstream Infection
-
PSI08-Postoperative Hip Fracture
-
PSI09-Postop Hemorrhage Or Hematoma
-
PSI12-Postoperative PE Or DVT
-
PSI13-Postoperative Sepsis
-
PSI14-Postoperative Wound Dehiscence
-
PSI15-Accidental Puncture/Laceration
-
PSI16-Transfusion Reaction
Capture more improvement opportunities
Provider Advisor provides hospital managers with the ability to identify specific opportunities for improvement at the physician, practice, specialty, facility, and organization level.
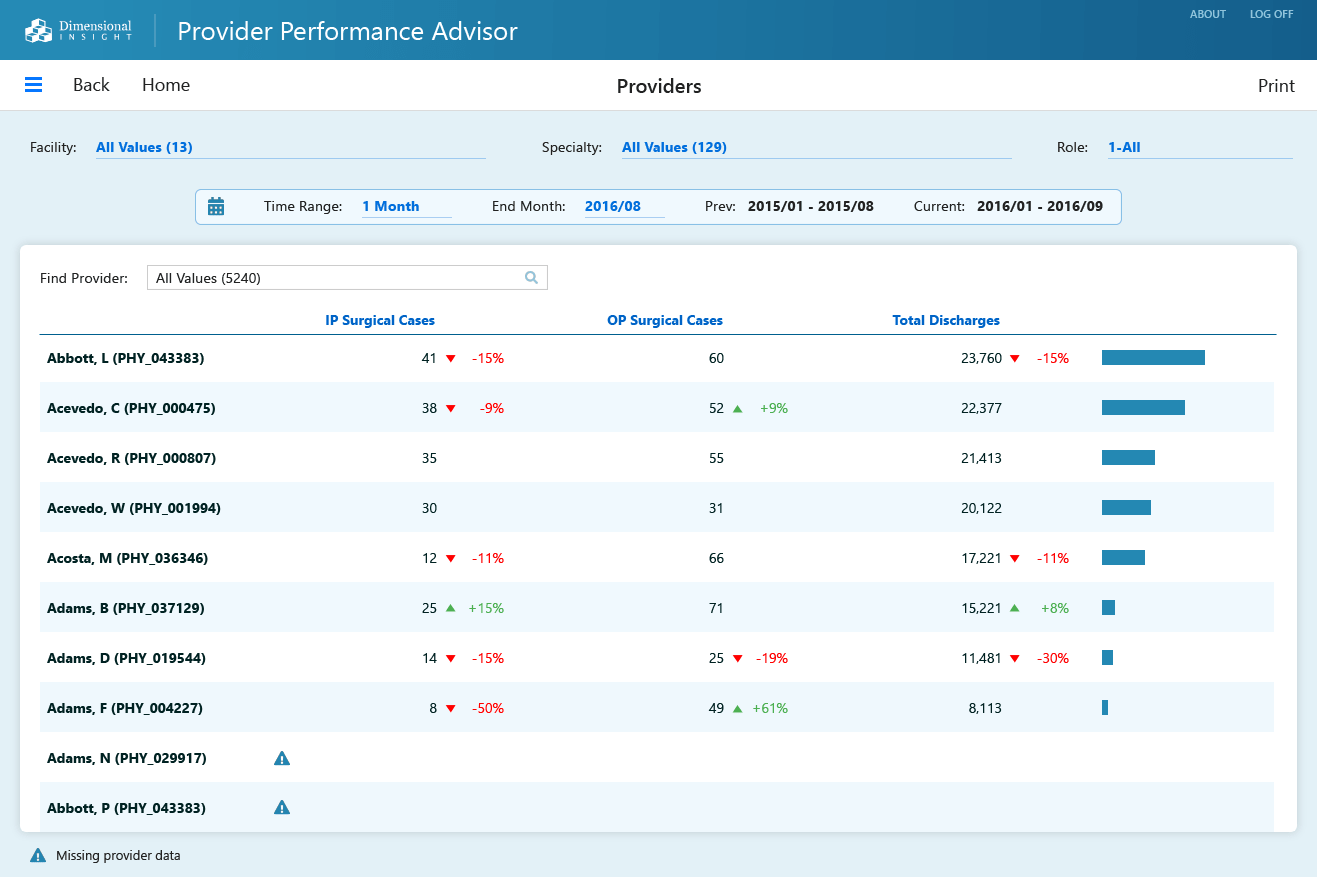
Compare Physicians
Compare individual physicians to standard benchmarks, as well as peers within their practice, specialty, and facility.
Spot Outliers
Spot outliers responsible for a disproportionate impact on organizational performance.
Detect Patterns
Detect patterns across the organization that reveal best practices.
Understand Affects
Understand how physician practice patterns affect overall hospital performance.
Focus Efforts
Focus efforts on improvements that most impact outcomes, meet cost containment goals, and increase revenues.
Examples of Provider Advisor Dashboards:
Explore these resources for more information
Watch Videos
See more healthcare application demonstrations.

Physician Performance Measurement
8 Things You Need to Know
Data Sheet
Read the Provider Advisor data sheet
