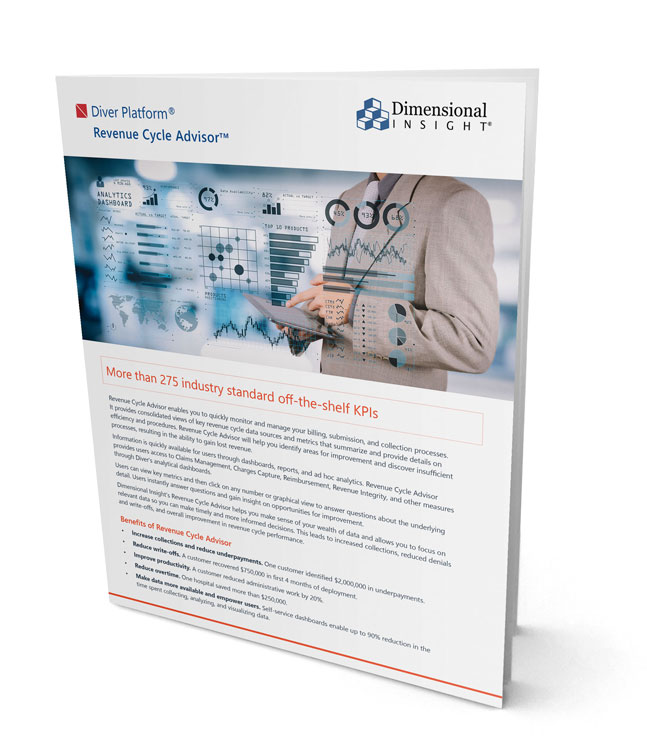
Revenue Cycle Advisor
Optimize efficiency and maximize cash flow with easy-to-deploy application

More than 100 pre-built KPIs to help assess performance against targets
Managing and monitoring it requires a level of vigilance that’s only possible with reliable, well-defined and timely information. That information can help to continuously pinpoint your best opportunities to improve processes, stay ahead of emerging trends, and maximize cash flow.
But when it’s spread across multiple systems and applications, each with their own reporting and analytics tools, the picture is anything but clear.
Dimensional Insight’s Revenue Cycle Advisor helps you take on that challenge to get the most from all of your available information.
Benefits of Revenue Cycle Advisor
Maximize cash flow
Collect revenue efficiently
Minimize denials
Understand value-based measures
Manage accounts receivable
See Revenue Cycle Advisor in action
Learn about the features and functionality of Revenue Cycle Advisor in this 15-minute video.
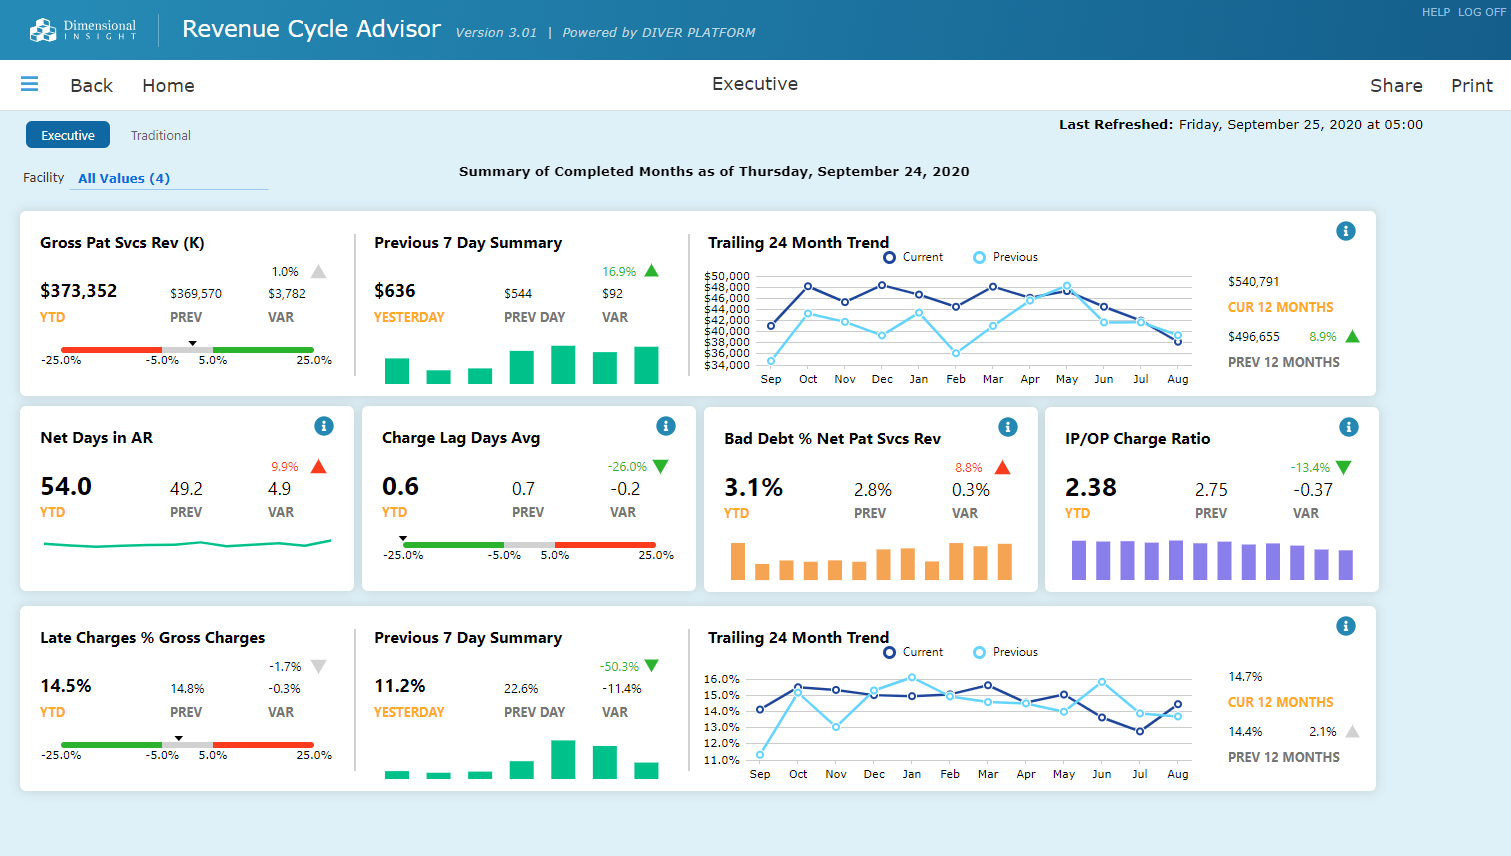
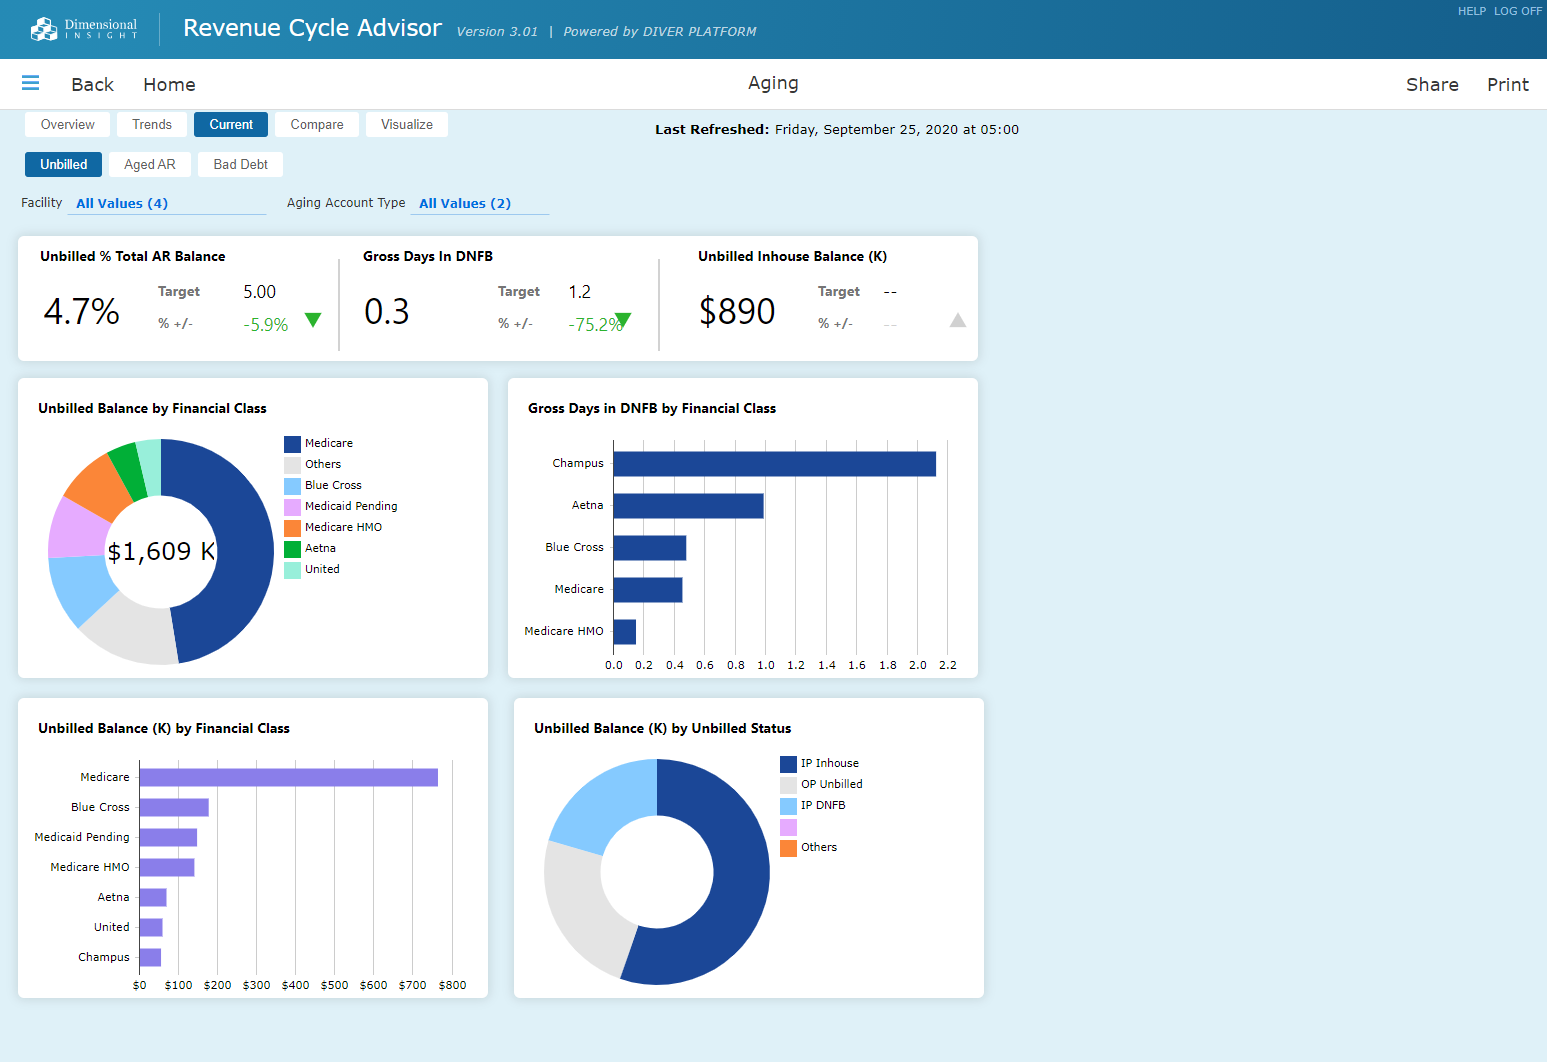
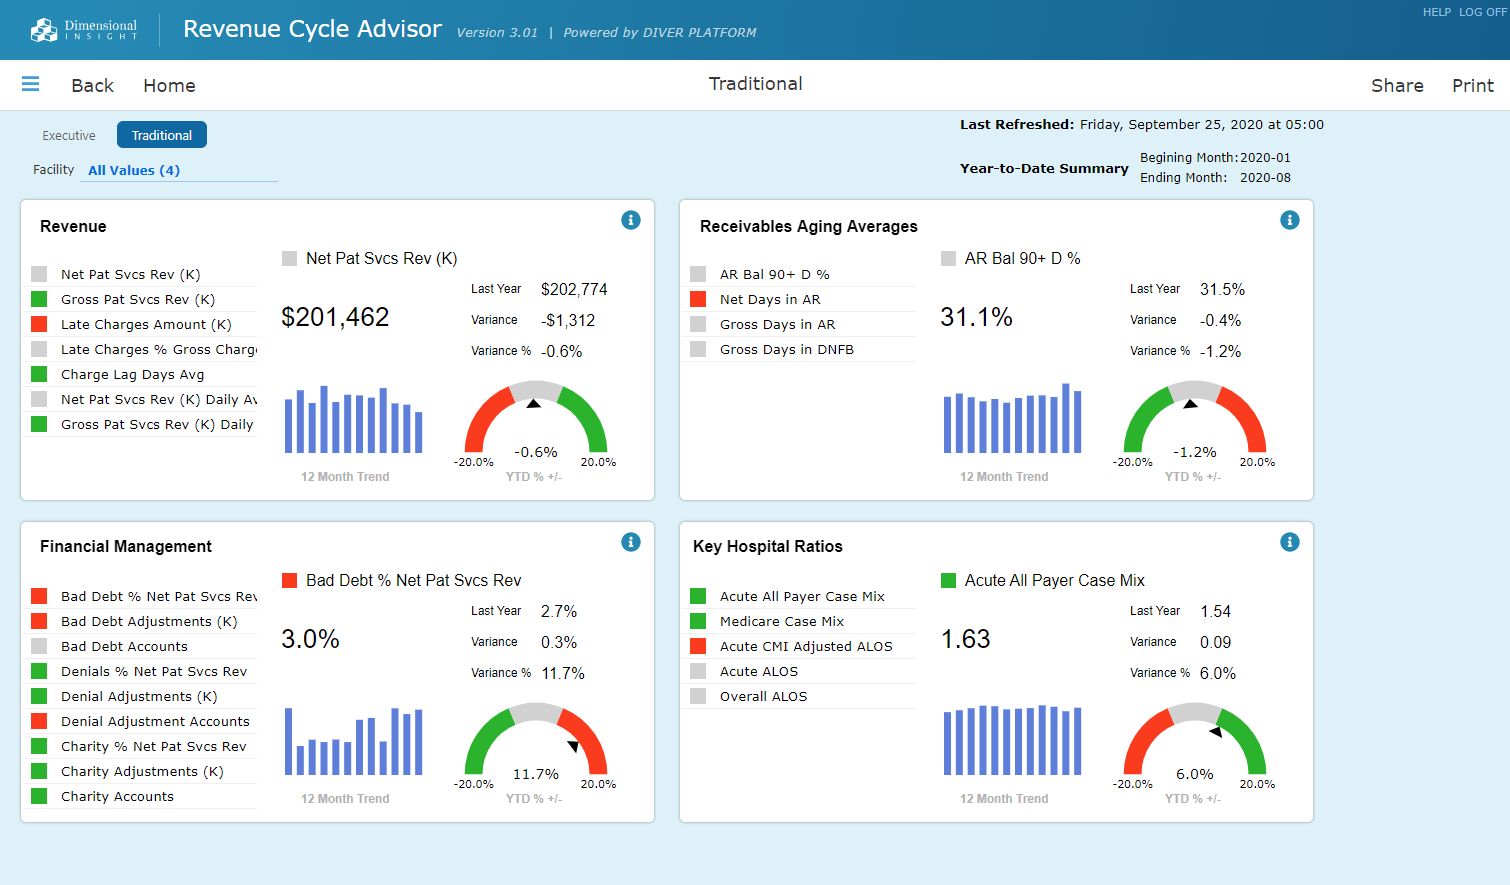
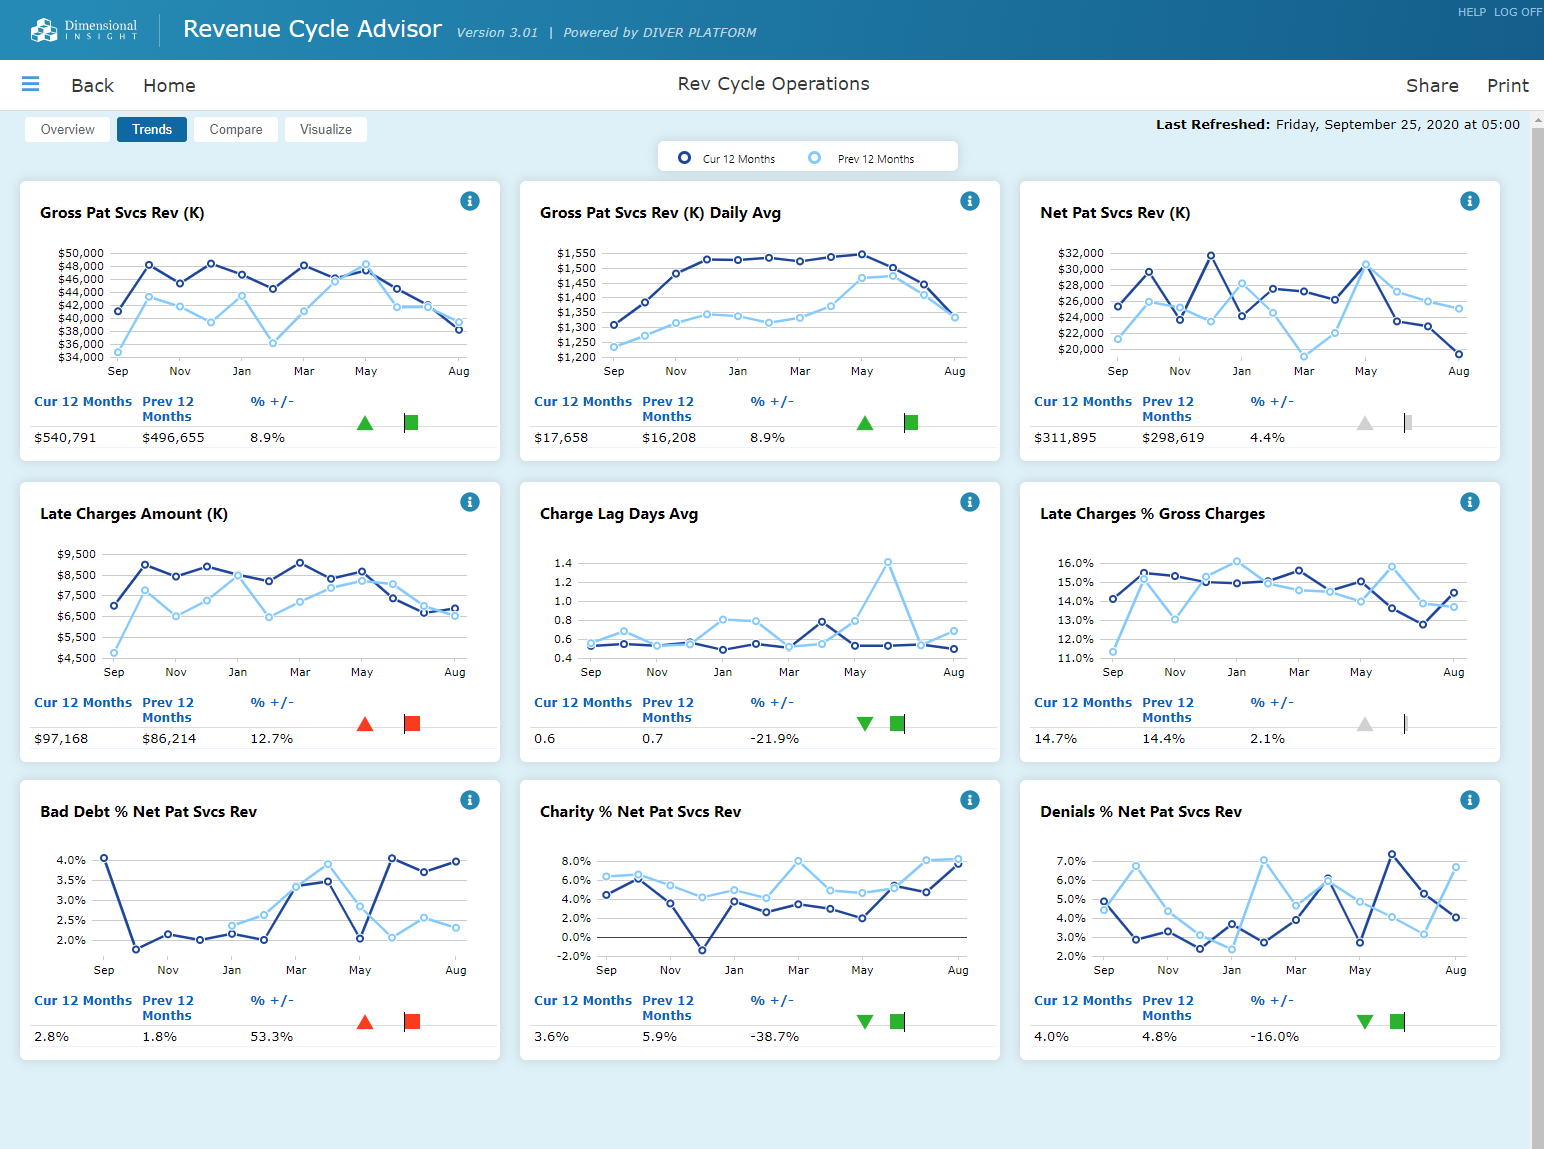
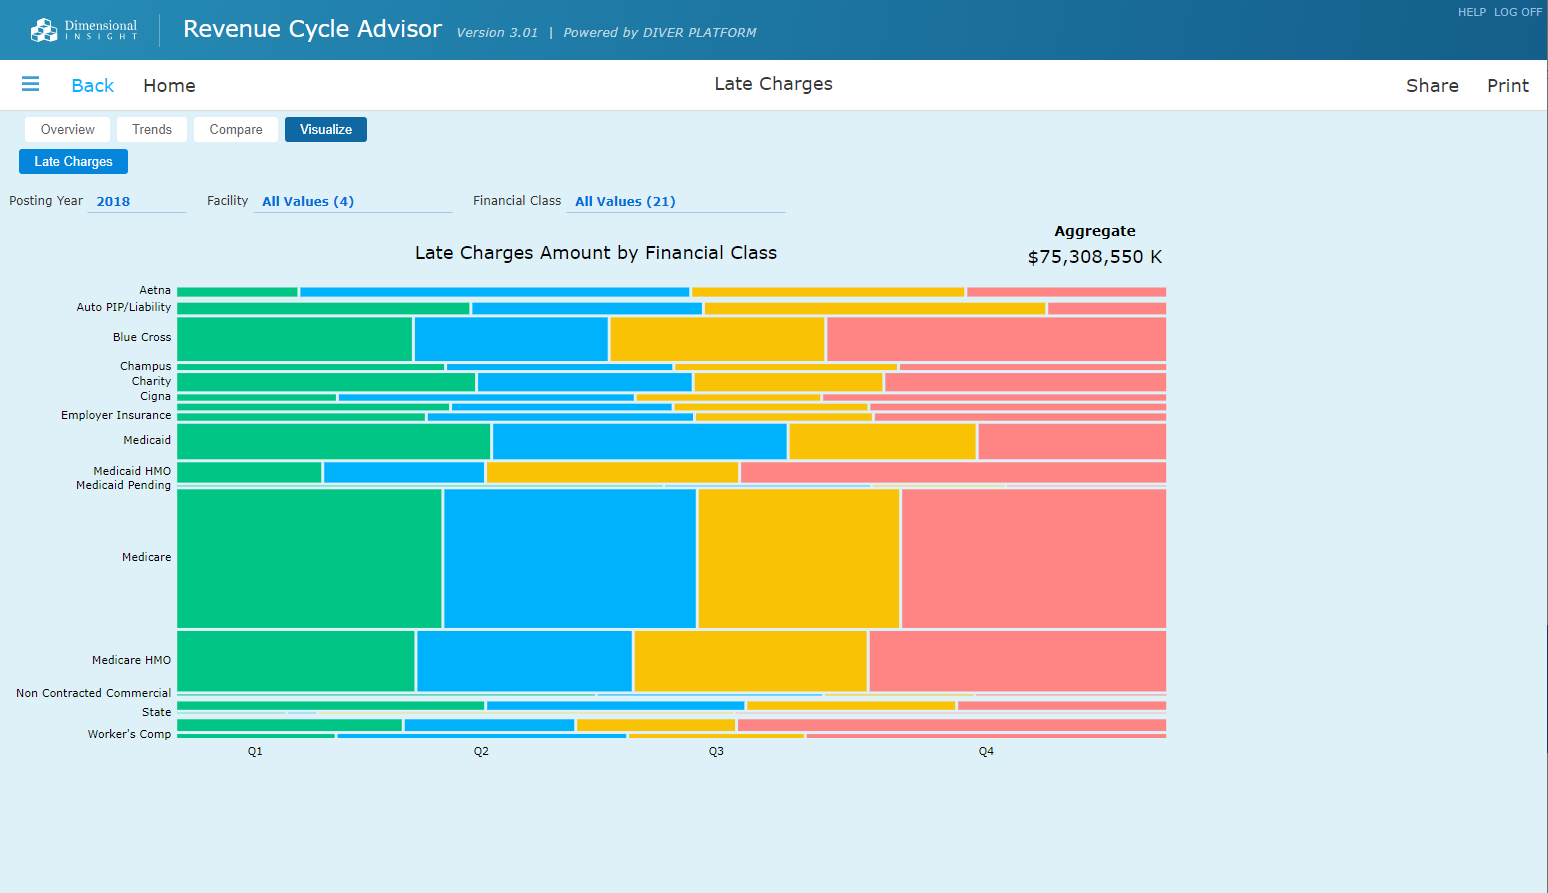
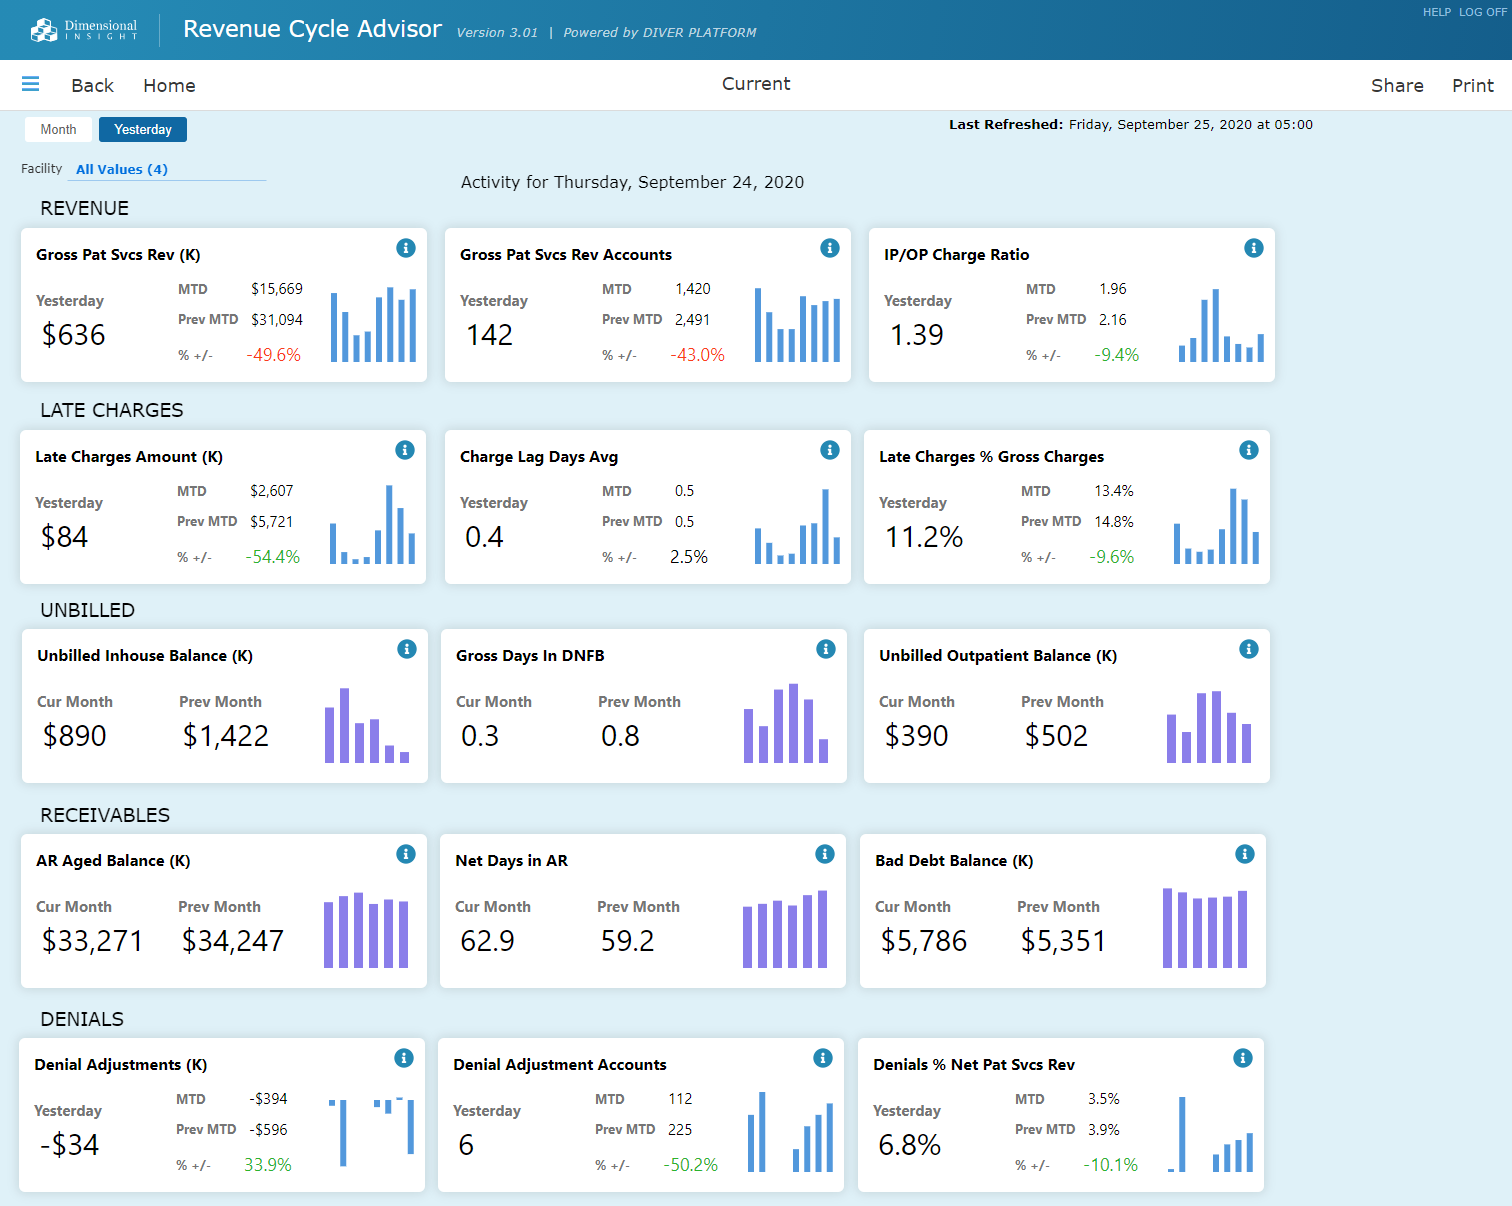
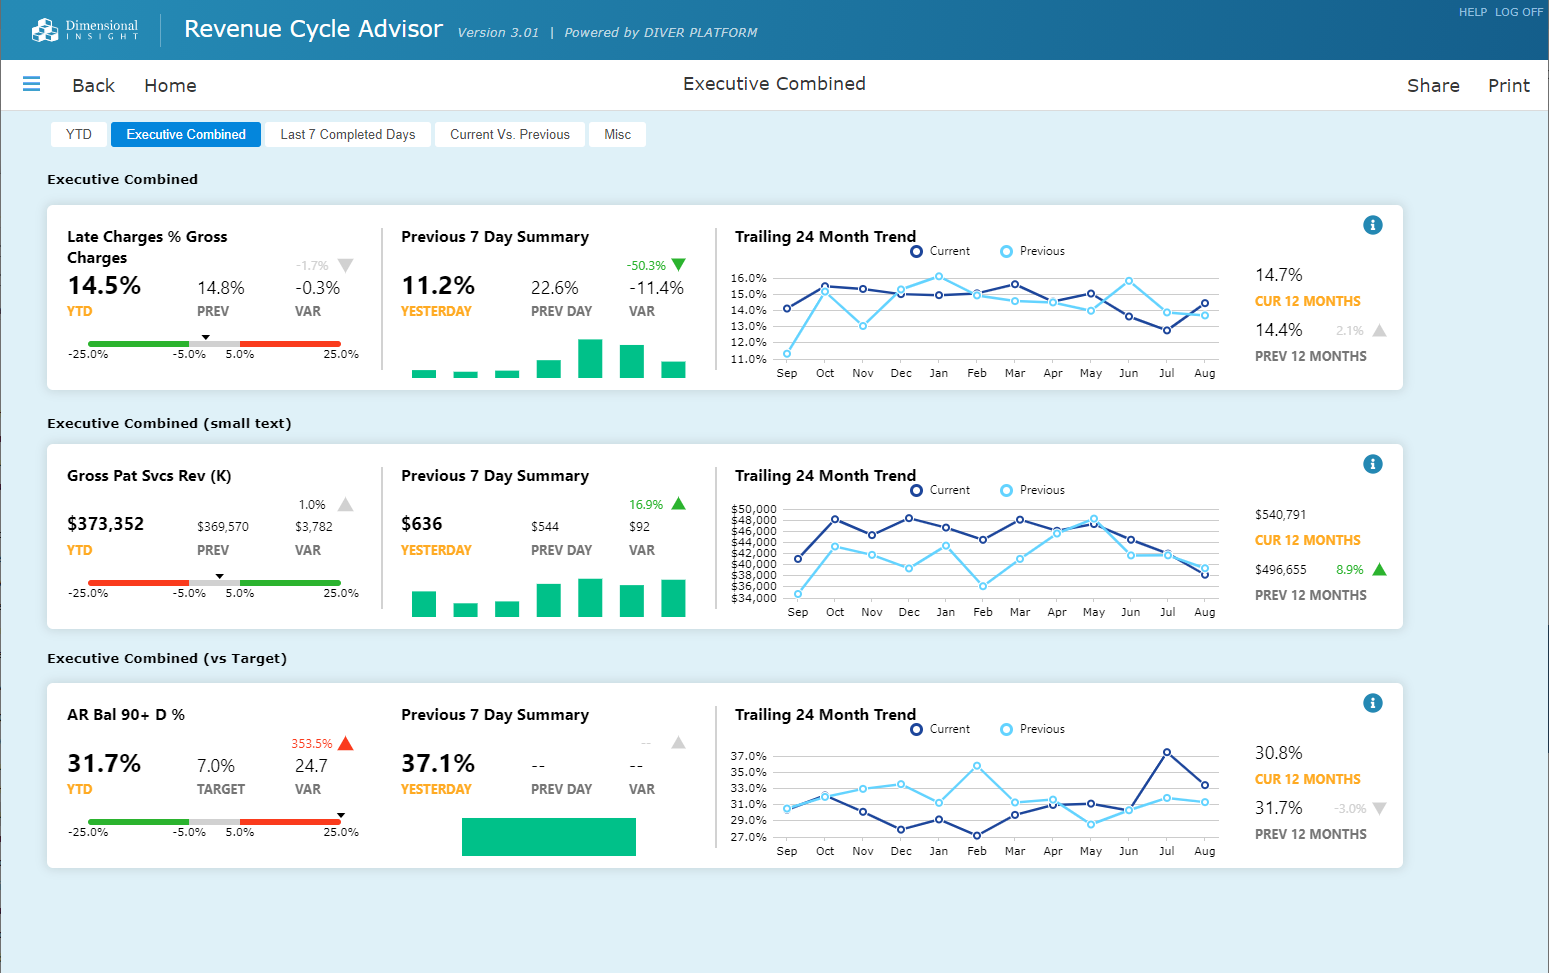
Examples of Revenue Cycle Advisor dashboards
Revenue Cycle Advisor comes with a variety of off-the-shelf dashboards and reports. There is a consistent look and feel throughout both Revenue Cycle Advisor and the rest of the Dimensional Insight Library of Applications.
Part of Dimensional Insight’s Library of Applications
Revenue Cycle Advisor is built on Dimensional Insight’s enterprise analytics platform. Deploying these applications results in deep and sustained clinical, financial, and operational improvements that impact patient care and your organization’s bottom line. Diver Platform and Dimensional Insight’s Library of Applications satisfy your health system’s enterprise reporting needs.
Benefits to the Library of Applications approach
Data trust across departments
Data governance ensures the use of consistent, standardized, validated, and documented business rules and measures across applications. This means all departments are using the same definitions for decision-making.
Quick to implement
Dimensional Insight uses a proven process that leads to short implementation times and quick time to value. Applications build on previously implemented Dimensional Insight apps, leading to even shorter deployment times, especially when compared to department-specific apps from multiple vendors.
Lower overall costs
Because Dimensional Insight Applications are all built upon Diver Platform, hospitals do not incur the high costs associated with licensing and supporting solutions from multiple vendors.
Consistent look and feel across application areas
Applications all have a consistent, intuitive look and feel. Moving from one application to another is seamless. Executives and other users do not have to learn several applications.
Designed to be customizable
Users access 1,000s of off-the-shelf industry-standard business rules that can be deployed “as is” or adjusted to your unique requirements.
Built on the award-winning, healthcare enterprise analytics platform: Diver Platform®
8 time Best in KLAS winner from 2010 to 2021
Our customers have perennially rated Diver Platform #1.
Leading edge technology
Enterprise analytics platform combines ETL, data management, and self-service analytics to provide a powerful engine that generates results for all types of users.
Data governance
Rigorous processes that manage and protect data ensure data trust and consistency across the organization.
Custom development
Since Diver is a development platform, customers can modify existing Dimensional Insight applications or build new ones on their own.
Data when and where you want it
Users can easily access data from their desktop, laptop, tablet, or phone.
Multiple deployment options
Organizations can host deployment on site, in the cloud, or via SaaS.
Explore these resources for more information